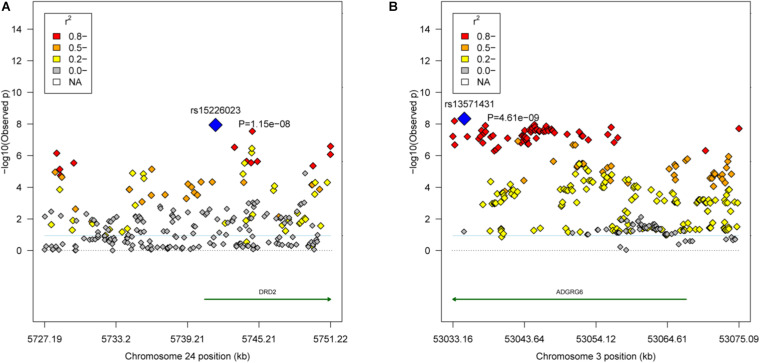
FIGURE 3.
Regional association plots of the candidate areas. (A) The QTL region GGA24: 5.73–5.75 Mb associated with the weight traits. The blue dot represents the lead SNP rs15226023. (B) The QTL region GGA3: 53.03–53.08 Mb associated with the carcass composition traits. The blue dot represents the lead SNP rs13571431. Different levels of linkage disequilibrium (LD) between the lead SNP and the surrounding SNPs are shown in different colors (red: r2 ≥ 0.8; orange: 0.5 ≤ r2 < 0.8; yellow: 0.2 ≤ r2 < 0.5; and gray: r2 < 0.2). The gene annotations were obtained from the University of California Santa Cruz (UCSC) Genome Browser (http://genome.ucsc.edu).

