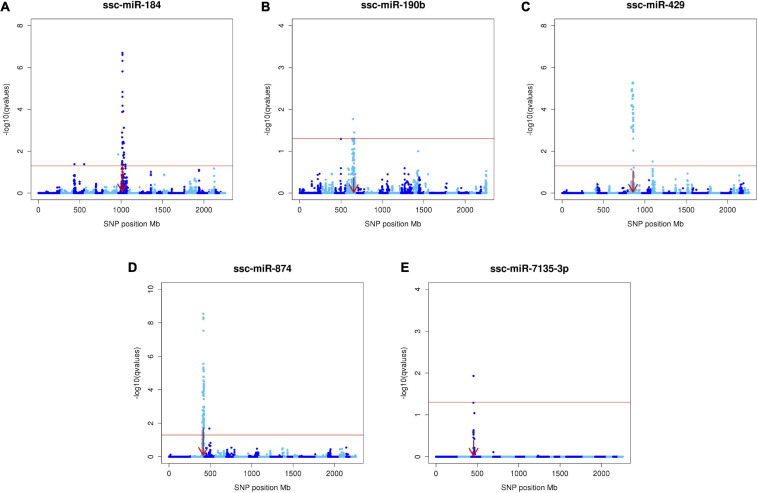
FIGURE 2.
Manhattan plots of the five local-acting miR-eQTL. Manhattan plots depicting the five local-acting miR-eQTL identified through GBLUP-based GWA models. For these miR-eQTL [ssc-miR-184 (A), ssc-miR-190b (B), ssc-miR-429 (C), ssc-miR-874 (D), ssc-miR-7135-3p (E)], the position of the miR-eQTL peak overlapped the genomic position of the miRNA precursor transcript (denoted by the red arrow). Each blue point represents one miRNA-SNP association, with chromosomes differentiated by shades of blue. The x-axis denotes the absolute SNP position (Mb), while the y-axis represents the significance of the miRNA-SNP association [-log10(q value)]. The red line designates the threshold of significance, declared at FDR < 0.05.

