
Fig. 4.
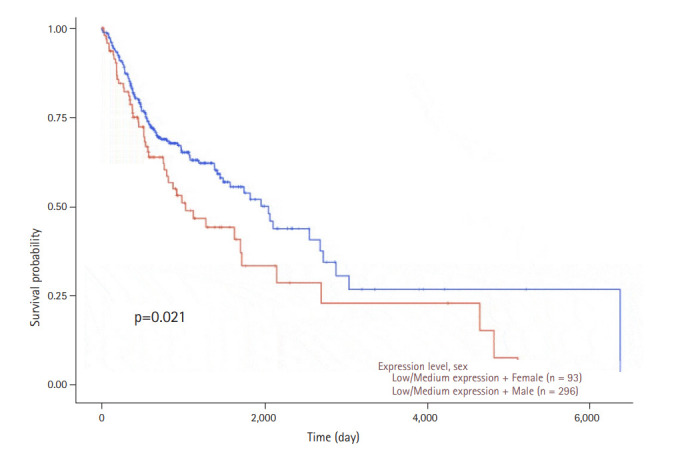
Kaplan-Meier plots showing the association of WNT11 gene expression in combination with the sex with head and neck squamous cell carcinoma patient’s survival. The x-axis represents time in days and y-axis shows the survival probability. The blue line indicates low/medium expression in male patients and the red line indicates low/medium level expression of the WNT11 gene in female patients. A significant difference in the survival probability was observed between the two groups (p = 0.021). Female subjects with a low/medium level expression presented with a low survival probability when compared to male subjects. A p-value less than 0.05 was considered to be significant.