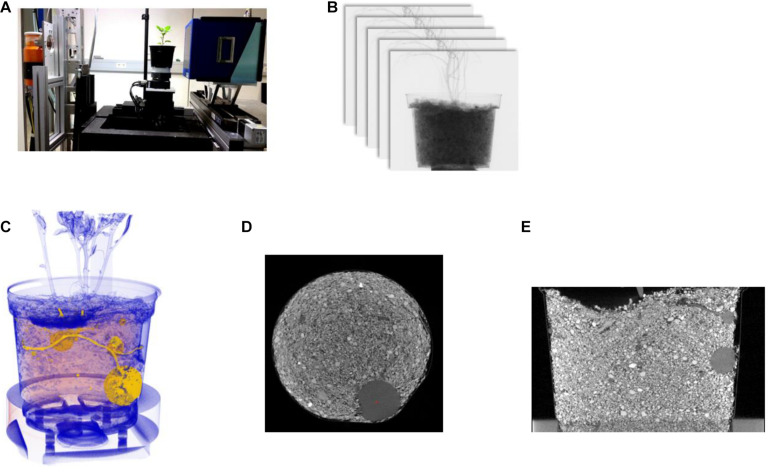
FIGURE 1.
Panel (A) shows a potato plant in the CT-System. On the left-hand side is the X-ray tube and on the right-hand side the detector, which collects the projections; panel (B) represents the stack of 2D projections; panel (C) shows a 3D visualization of the reconstructed and segmented data; (D) horizontal and (E) the vertical cross-section.

