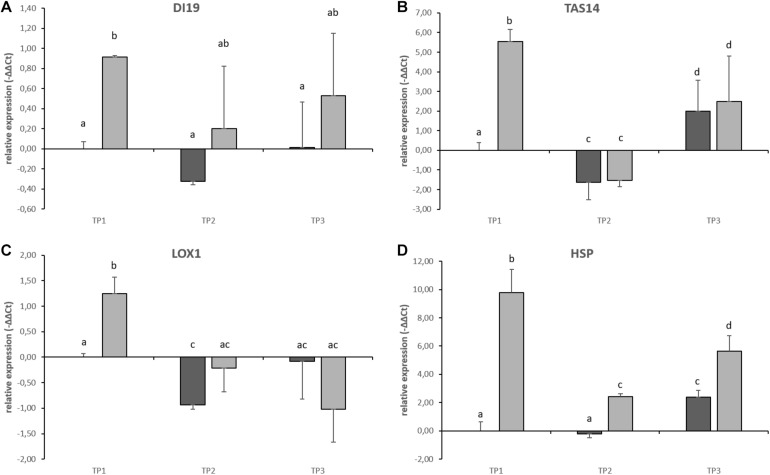
FIGURE 8.
qRT-PCR on stress-responsive gene expression in tuber samples of the potato cultivar Diamant. Results from control plants are shown in dark gray, stress treated plants are shown in light gray. Error bars represent standard deviation of three to four biological replicates. (A) Drought-induced 19 (DI19), (B) Abscisic acid and environmental stress-inducible protein (TAS14), (C) Lipoxygenase 1 (LOX1), and (D) Heat-shock protein (HSP). Different subscript letters indicate statistically different expression (p < 0.05).

