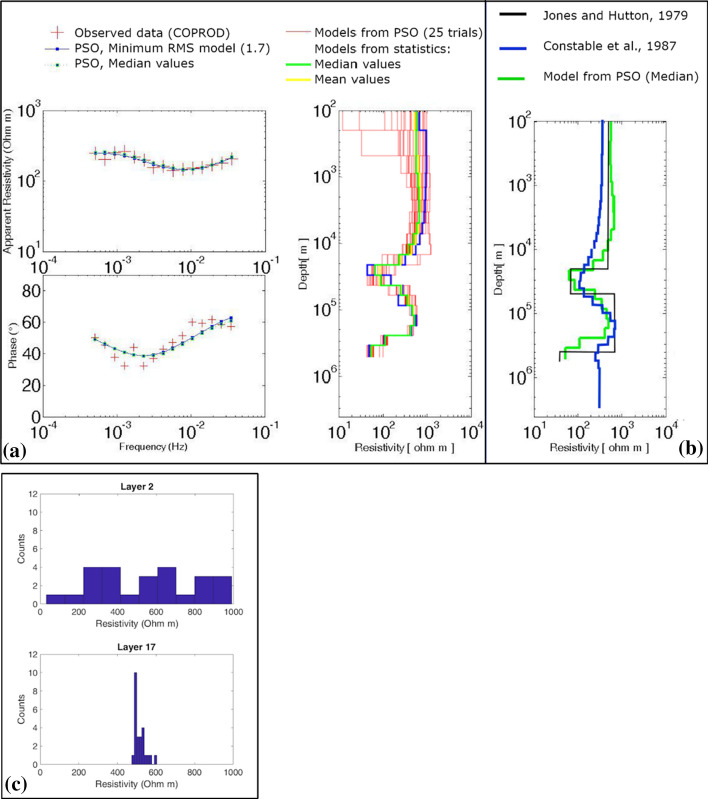
Fig. 8.
a PSO of COPROD MT data (modified from Godio and Santilano 2018 after Jones and Hutton 1979): on the left, data fitting for apparent resistivity and phase between observed data (red cross) and calculated response (blue dotted line) and on the right, the 1-D resistivity models from PSO (red lines), the mean model (yellow line) and the median model (green line); b comparison between the PSO model (green) and the models from Constable et al. (1987) (blue) and from Jones and Hutton (1979) (black); c the a posteriori probability density (ppd) function of layers 2 and 17 from the PSO trials in a: the histograms show a multimodal and a unimodal distribution, respectively

