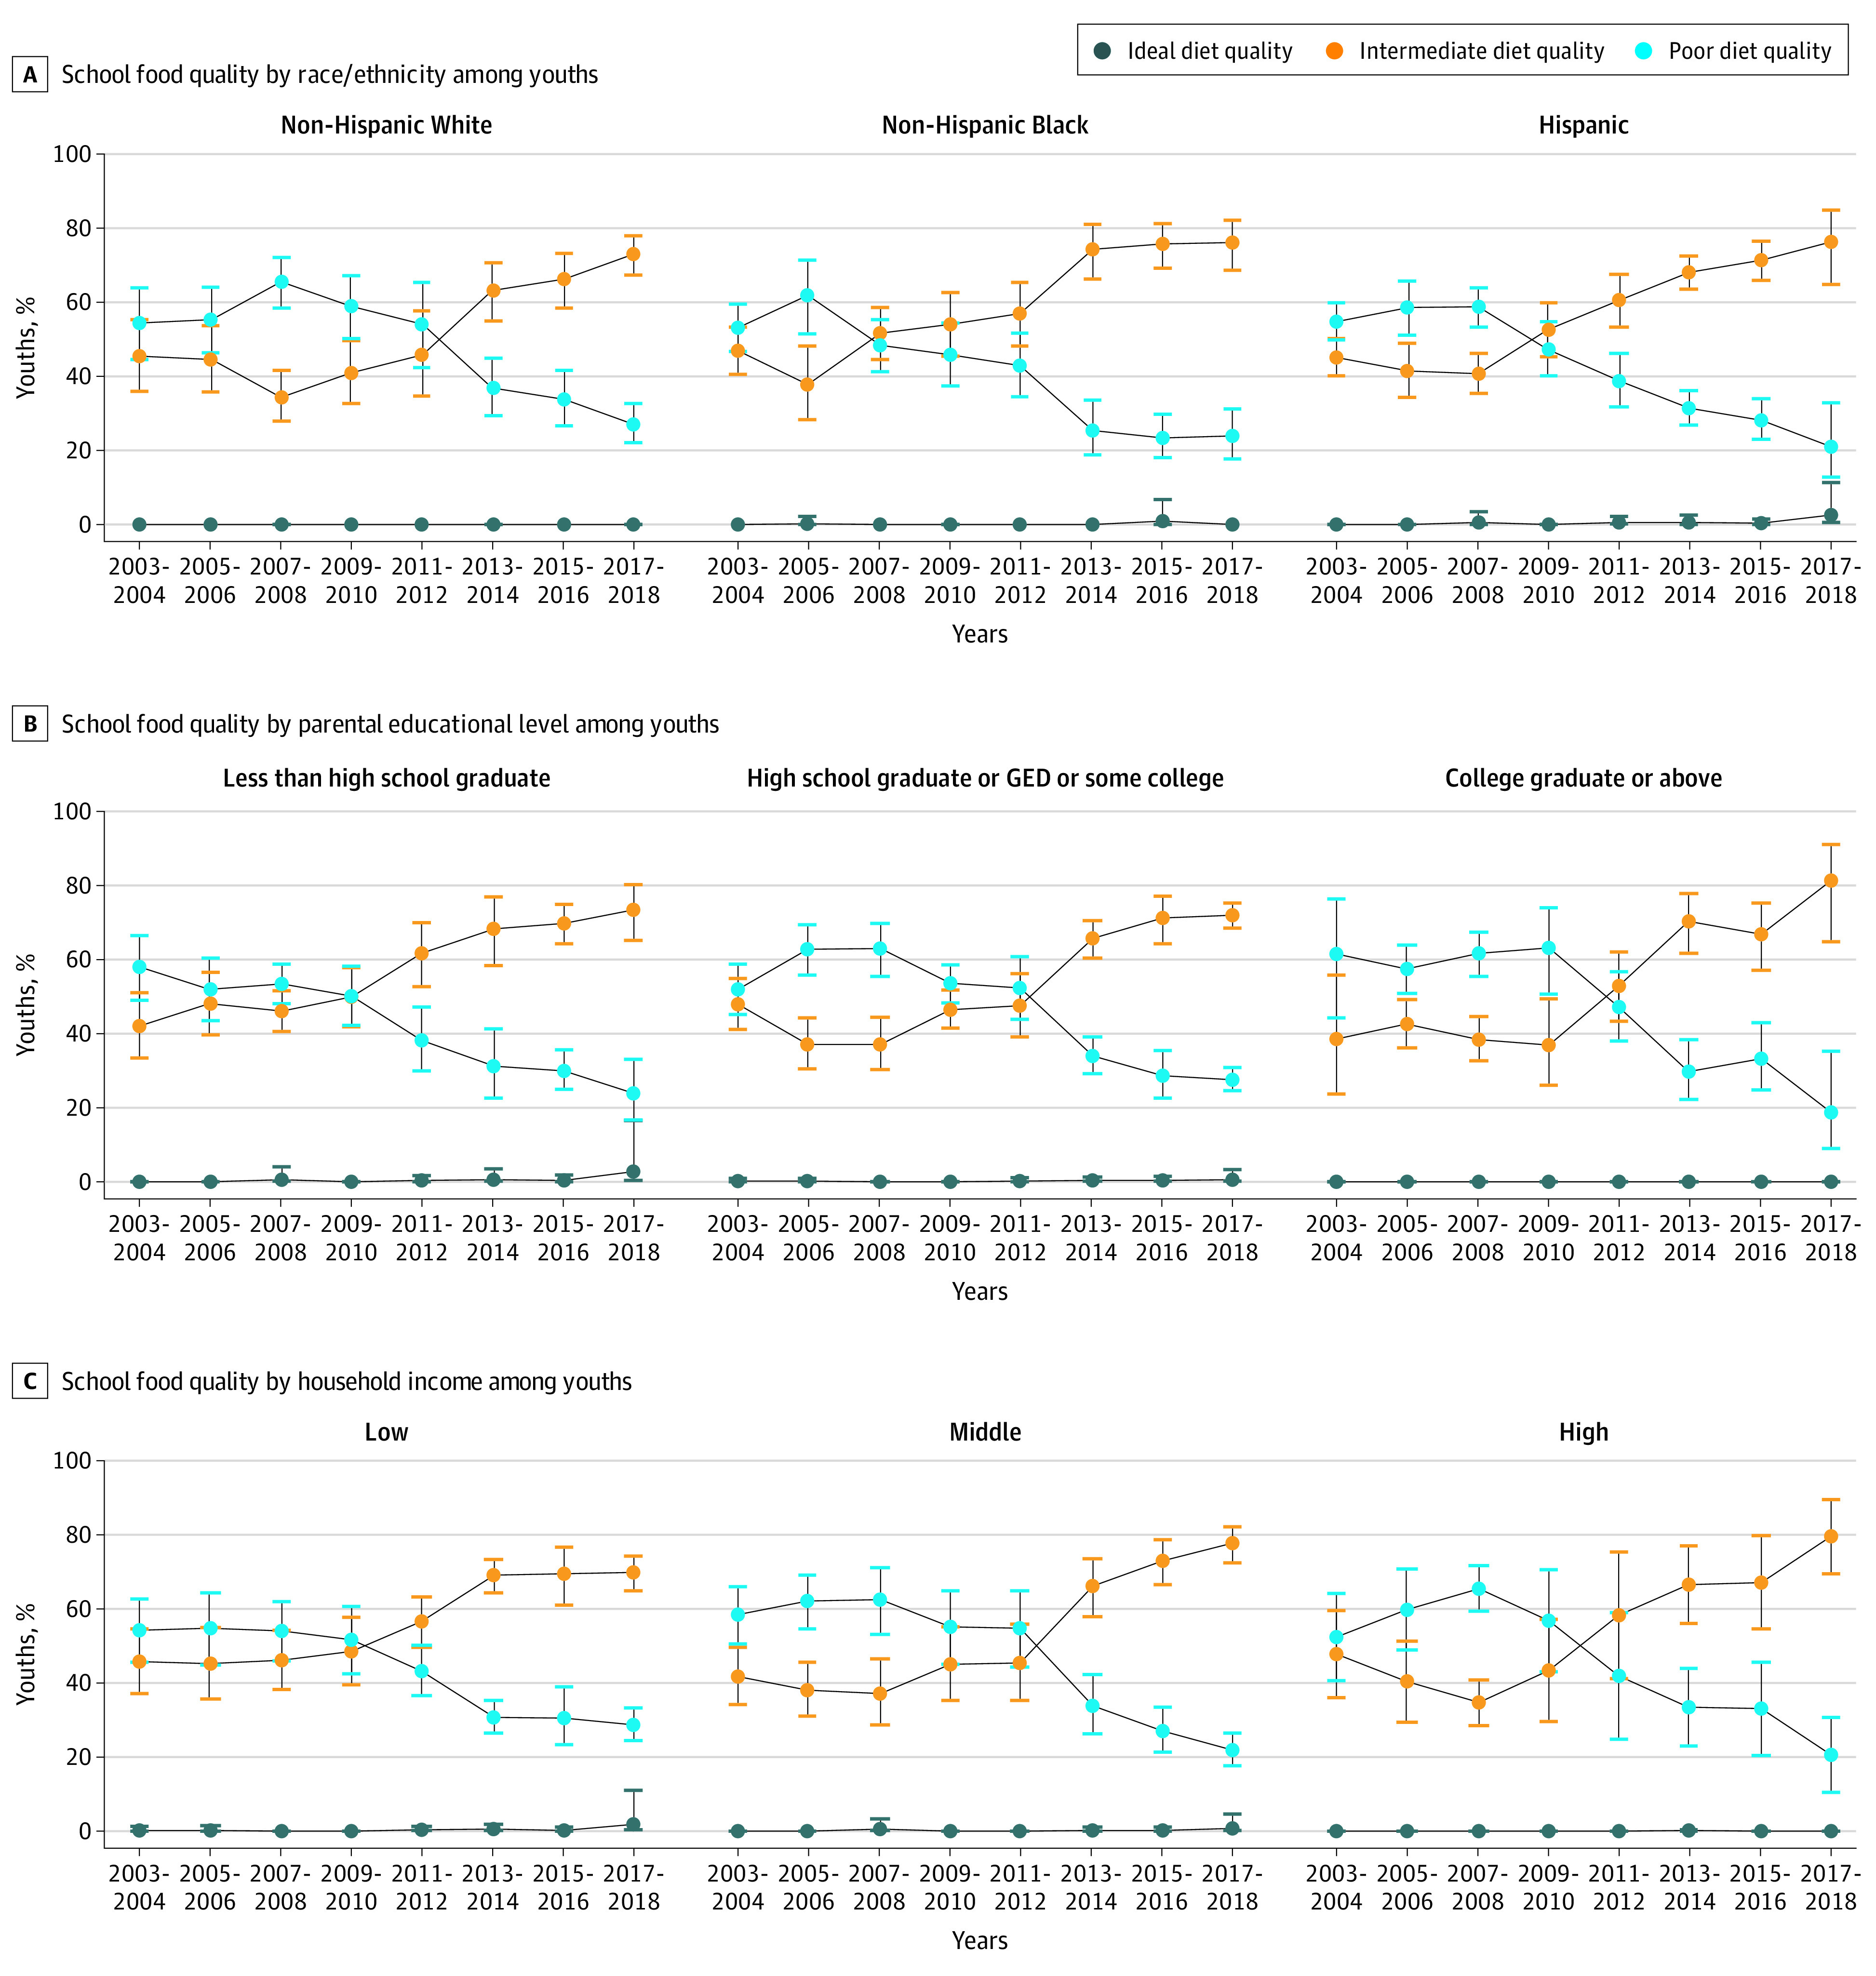
Figure 1. Trends in Estimated Proportions of US Children With Poor, Intermediate, or Ideal Diet Quality for Foods Consumed From Schools by Race/Ethnicity, Parental Educational Level, and Household Income, National Health and Nutrition Examination Surveys 2003-2018.

The American Heart Association score is based on total fruits and vegetables; whole grains; fish and shellfish; nuts, seeds, and legumes; sugar-sweetened beverages; processed meat; sodium; and saturated fat. Data were weighted to be nationally representative. Data points indicate estimated percentages; error bars, 95% CIs. By race/ethnicity, P < .001 for trend and P = .12 for interaction for all; by parental educational level, P < .001 for trend and P = .39 for interaction for all; and by household income, P < .001 for trend and P = .18 for interaction for all (see eTable 12 in the Supplement for details). GED indicates General Educational Development.
