
Figure. Changes in Levels of IgA and IgG in Breast Milk Over Time.
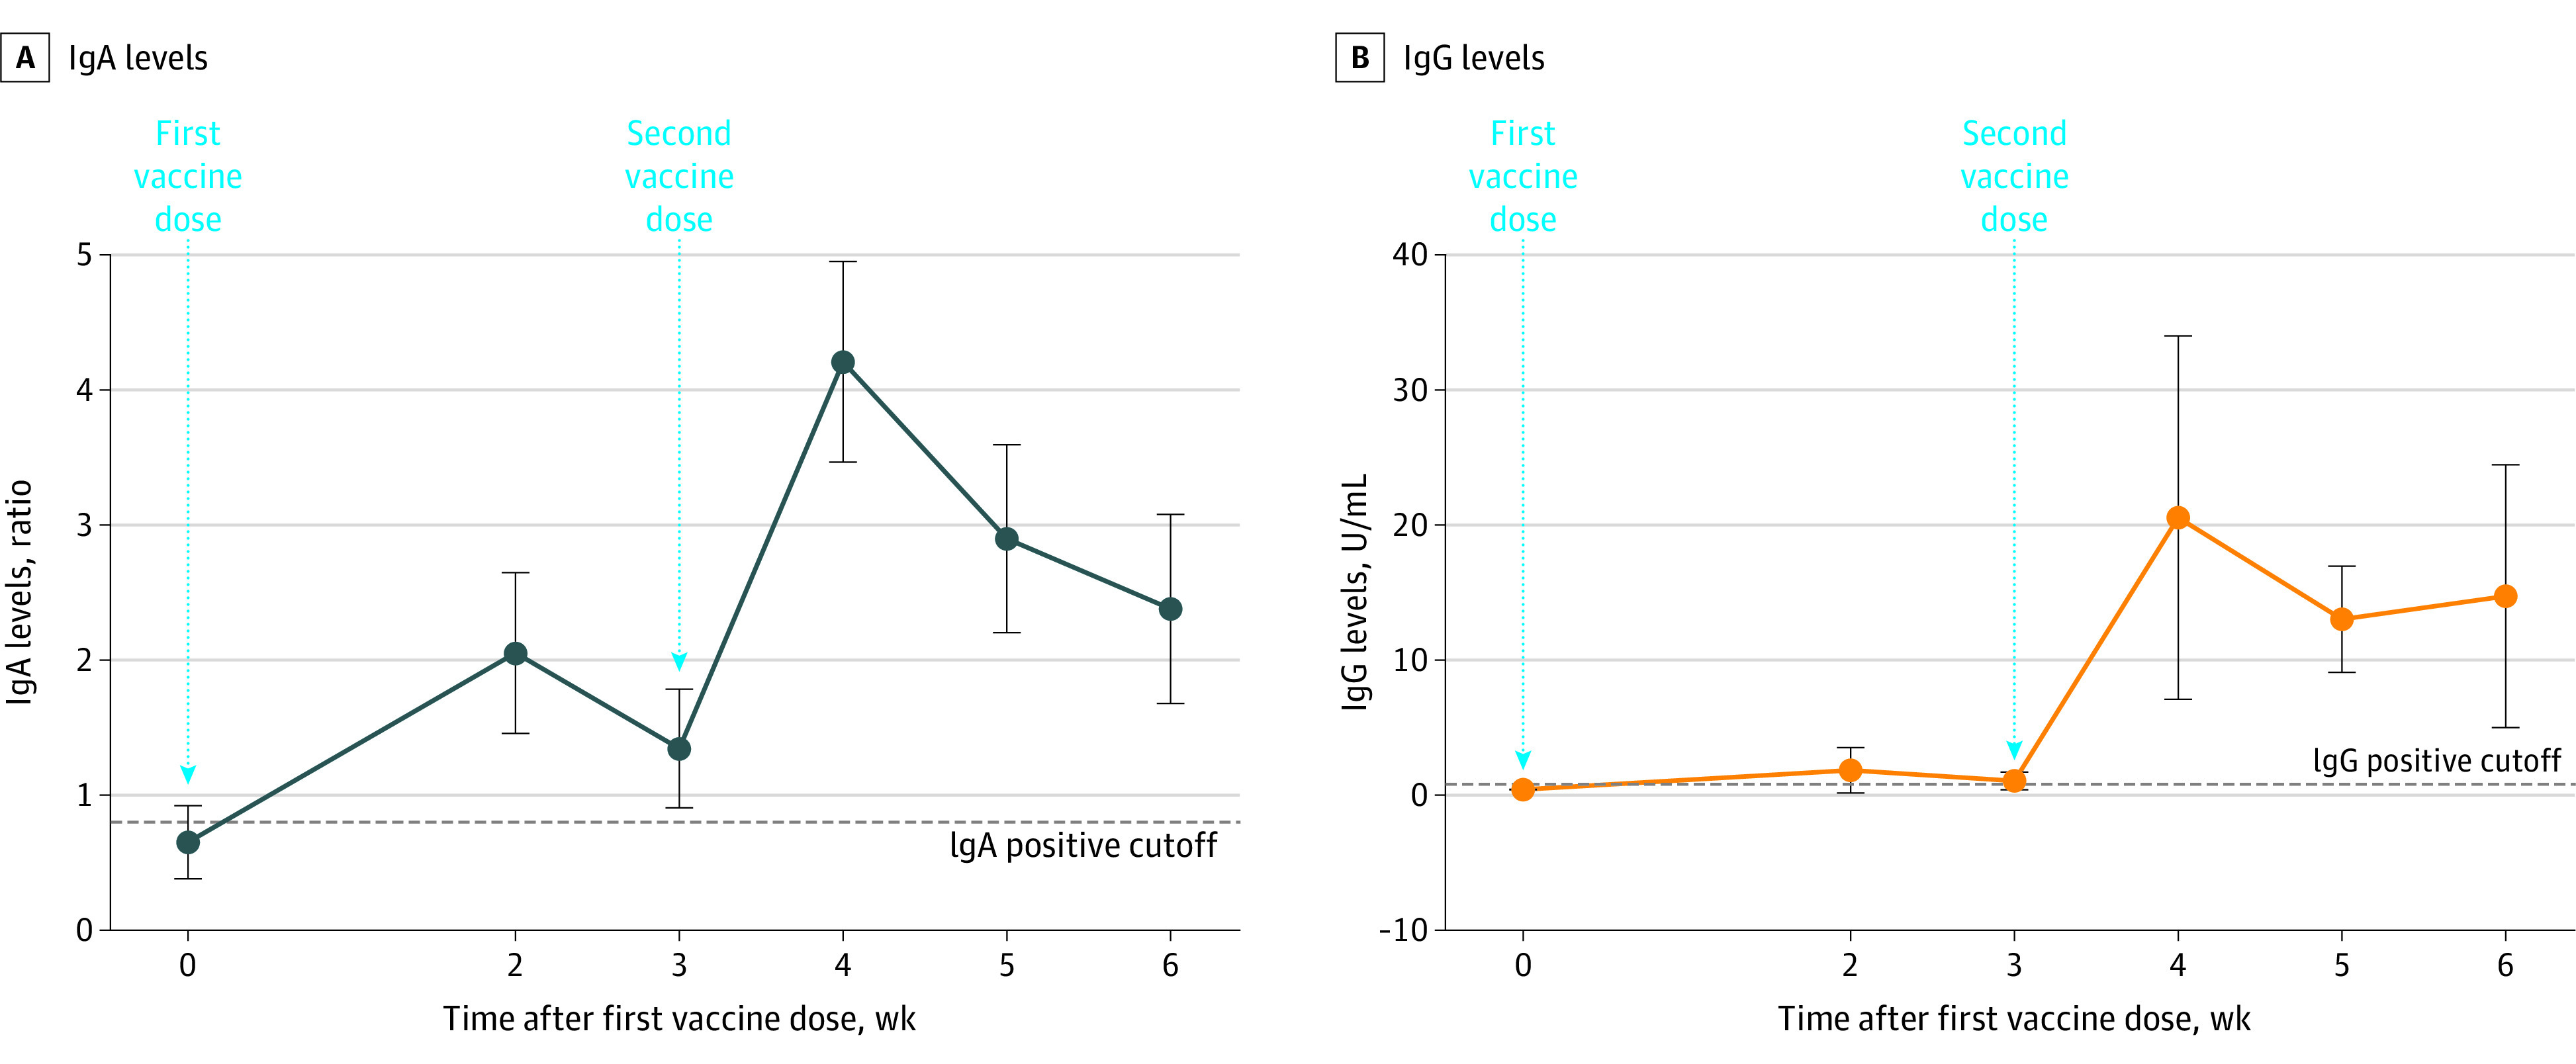
A, All the comparisons between time points are P < .001. B, The comparison point at week 4 is P = .004; at week 5, P <.001; and at week 6, P = .005.
Data points represent means; error bars, 95% CIs.