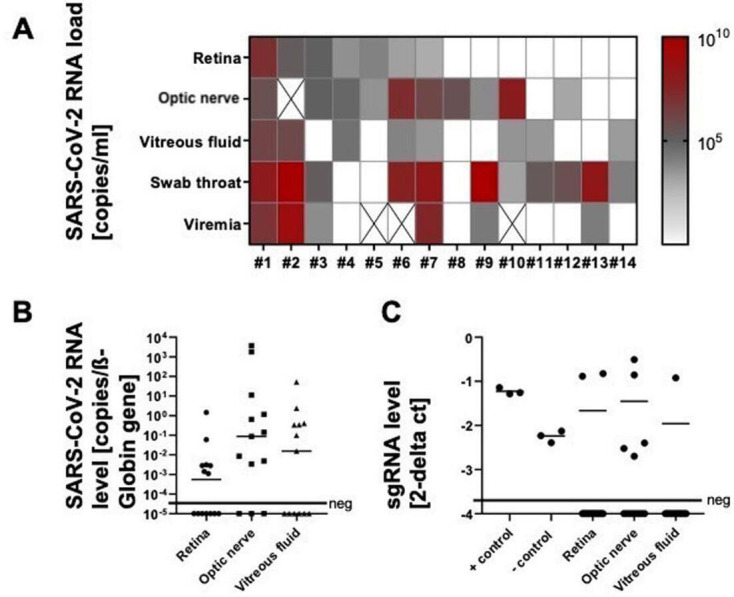
Figure 1.

Detection of SARS-CoV-2 RNAs. SARS-CoV-2 RNA loads in eye samples, blood and throat swabs are displayed for each patient (patient number on the x-axis) (A); blank cells reflect SARS-CoV-2 RT-PCR negative samples, and X indicates samples that were not available for analysis. For eye samples, virus-to-cell ratio (B) and levels of sgRNA (C) are illustrated. Mean values are given by horizontal bars. Negative samples are shown below the horizontal bar marked ‘neg’. SARS-CoV-2 infected Vero cells served as positive control, while cell culture supernatants of the respective cultures served as negative control. sgRNA, subgenomic RNA.
