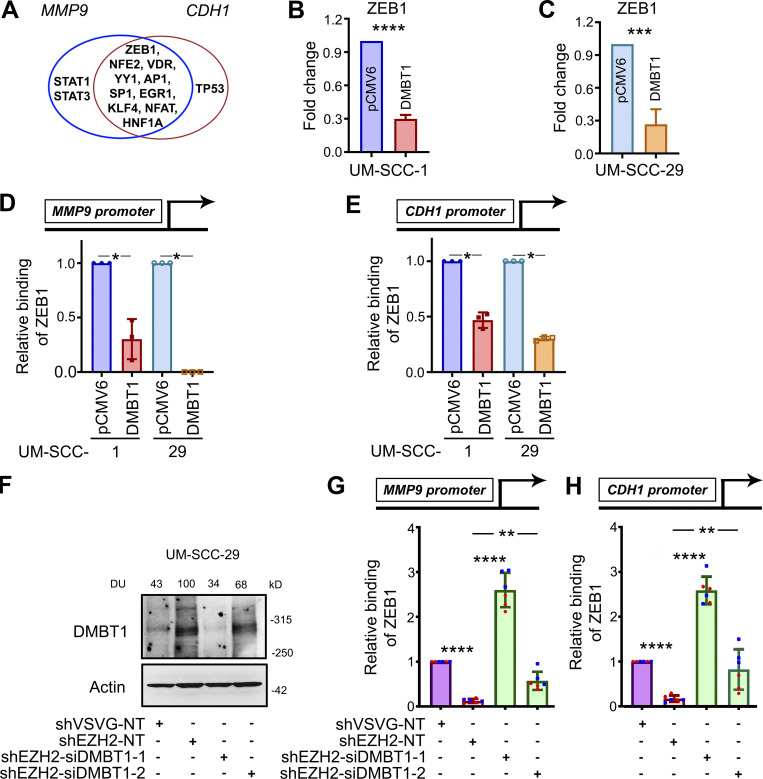
Figure 4.
ZEB1 down-regulates DMBT1 by binding promoter regions of MMP9 and CDH1. (A) Venn diagram showing transcription factors with binding sites in the promoter regions of MMP9 and CDH1, including ZEB1, NRF2 (NFE2), VDR, YY1, c-Jun (AP1), SP1, EGR1, KLF4, NFATC1 (NFAT), HNF1 (HNF1A), STAT1, STAT3, and TP53. (B and C) Q-RT-PCR of UM-SCC-1-pCMV6, UM-SCC-1-DMBT1, UM-SCC-29-pCMV6, and UM-SCC-29-DMBT1. Data are normalized to GAPDH. Relative expression of ZEB1 transcription factor in cells overexpressing DMBT1 is shown as fold change with respect to control (pCMV6) cells (***, P < 0.001; ****, P < 0.0001; t test; n = 2; error bars represent SD). (D and E) Q-RT-PCR was performed with ChIP-eluted DNA from UM-SCC-1-pCMV6, UM-SCC-1-DMBT1, UM-SCC-29-pCMV6, and UM-SCC-29-DMBT1 with validated primers specific to the ZEB1-binding site in the promoter region of MMP9 (D) and CDH1 (E; *, P < 0.05; t test; n = 2; error bars represent SD). (F) Immunoblot validation of DMBT1 down-regulation in lysates from UM-SCC-29-shVSVG and -shEZH2 transfected with nontarget siRNA (NT) or siDMBT1 (-1 and -2), as indicated. (G and H) Q-RT-PCR with ChIP-eluted DNA from UM-SCC-29-shVSVG and UM-SCC-29-shEZH2 (NT, siDMBT1-1, and siDMBT1-2) for standardized primers targeting the ZEB1-binding site in the promoter region of MMP9 (G) and CDH1 (H). Scatter plots show two independent experiments; each color represents an independent experiment (**, P < 0.01; ****, P < 0.0001; one-way ANOVA; error bars represent SD).

