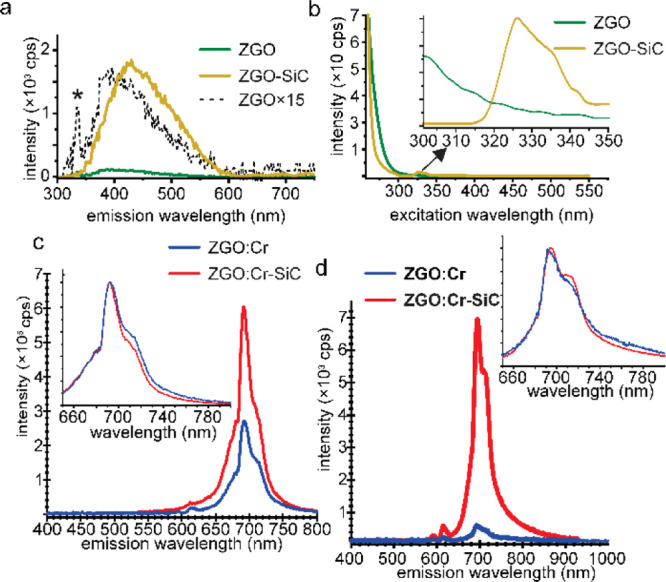
Figure 3.

(a) RT-PL (290 nm UV illumination) and (b) PLE spectra of ZGO and ZGO–SiC NPs without Cr3+ ion doping. The asterisk in (a) marks the Raman peak of water, whereas the black curve in (a) represents the ZGO spectrum multiplied by 15 to compare luminescence shapes and maxima. The inset in (b) shows the PLE peak of ZGO–SiC originating from the SiC NPs. (c) RT-PL (290 nm UV illumination) and (d) XEOL spectra (non-monochromatized X-rays, 5–30 keV) of ZGO/Cr and ZGO/Cr–SiC NPs. The inset in (b) shows the PLE peak of ZGO–SiC originating from the SiC NPs. Insets (c,d) show spectra normalized to peak intensity.
