
Fig. 2.
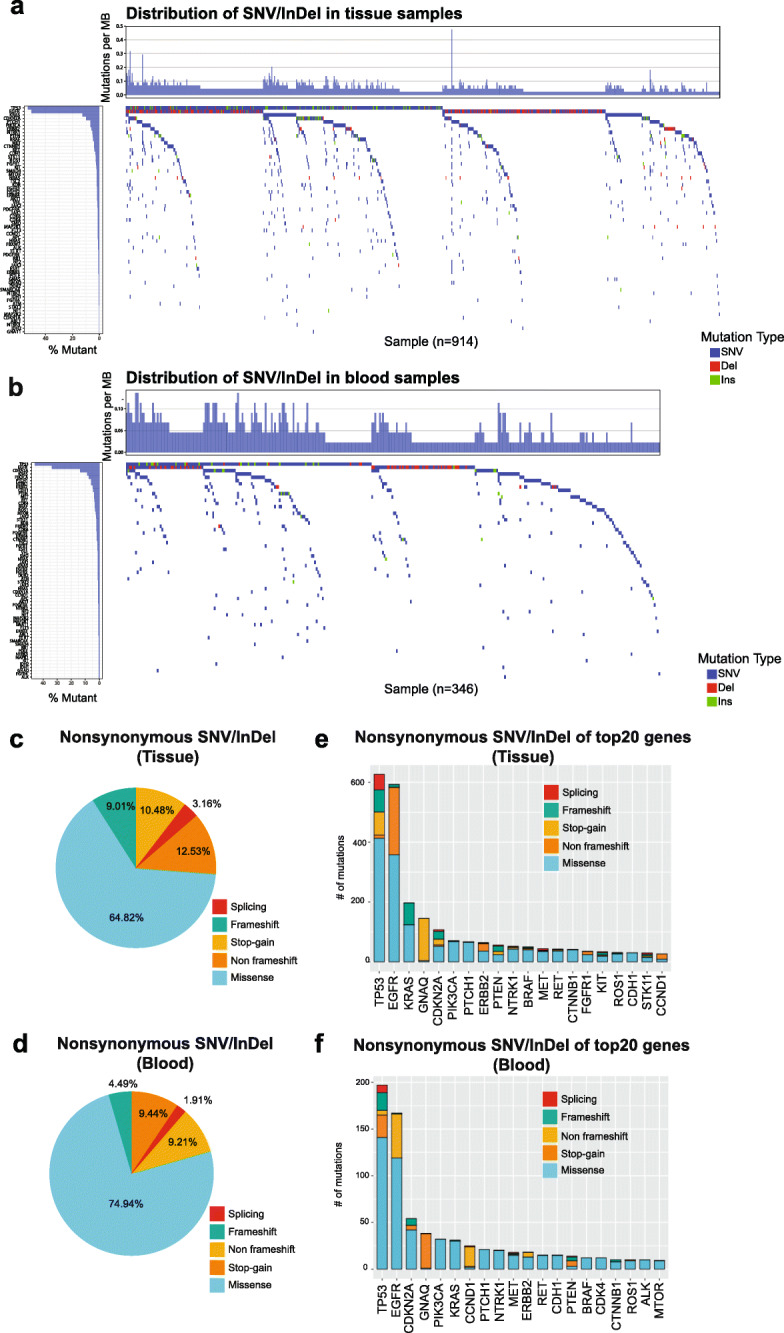
Significantly mutated genes in NSCLC. Waterfall plot of the distribution of SNV/InDel mutations found in tissue (a) and blood (b) patient samples. The top plot show number of mutations per Mb sequenced for a cohort of 914 NSCLC samples. Left plot shows the frequency of samples mutated for the listed gene. The central plot shows the types of mutations (SNV, Insertion, Deletion) in each sample. The distribution of nonsynonymous frameshift insertions and deletions, missense mutations, Stop-gain, and other infrequent alterations (e.g. splicing) in both the tissue (c, e) and blood samples (d, f)