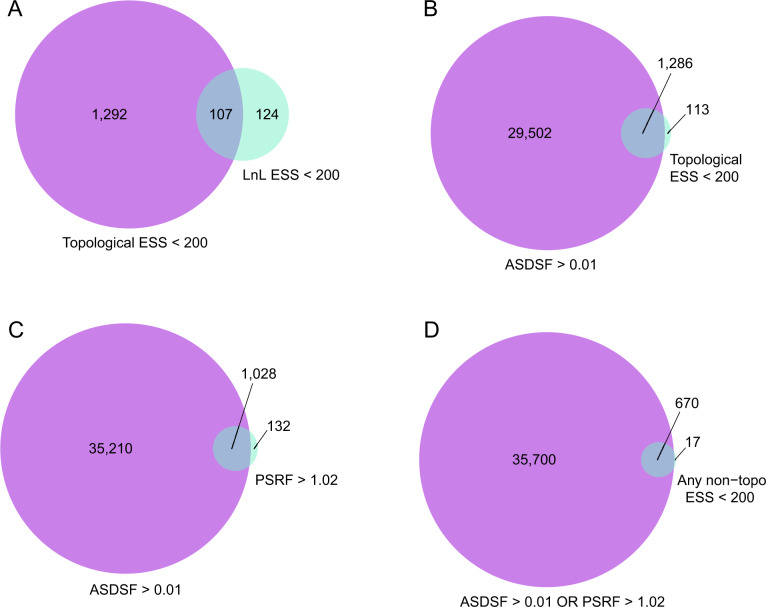
Fig. 3.
Venn diagram showing the number of chains that fail either one or both convergence diagnostics indicated under each circle. Part (A) shows chains that fail topological ESS, LnL ESS, or both. Part (B) shows chains that fail ASDSF, topological ESS, or both. Part (C) shows chains that fail ASDSF, PRSF, or both. Part (D) shows chains that fail ASDSF, any non-topological ESS, or both.

