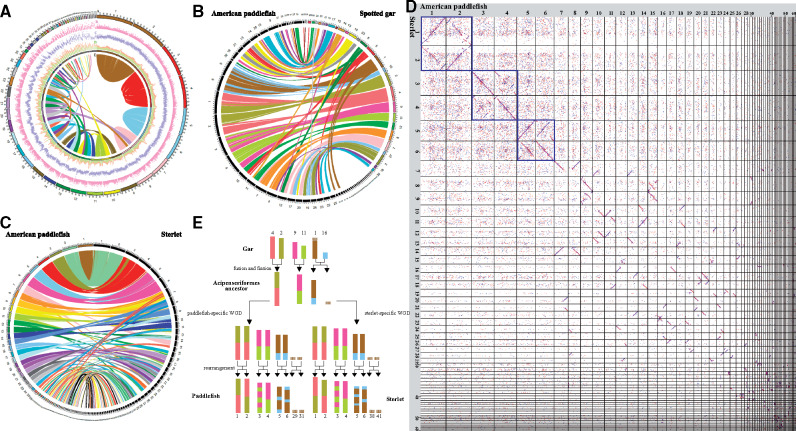
Fig. 2.
Chromosomal evolution of American paddlefish. (A) Intraspecific chromosome comparison within American paddlefish. From outside to inside: (a) chromosome number, (b) gene distribution, (c) Repeat distribution, (d) GC content distribution, and (e) Synteny links. (B) Interspecific chromosome comparison between American paddlefish and spotted gar. The left black columns represent the 60 chromosomes of the American paddlefish, and the right colored columns represent the 29 chromosomes of the spotted gar. (C) Interspecific chromosome comparison between American paddlefish and sterlet. The left colored columns represent the 60 chromosomes of the American paddlefish, and the right black columns represent the 60 chromosomes of the sterlet. (D) Dotplots for sequence alignments between the chromosomes of American paddlefish and the corresponding chromosomes of sterlet (sorting from the longest Chr1 to the shortest Chr60). (E) Deduced ancestral chromosomes of the Acipenseriformes.

