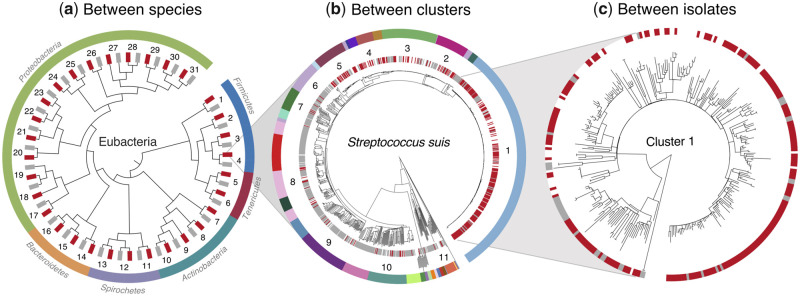
Fig. 1.
The evolution of pathogenicity over three evolutionary scales: (a) between species of bacteria, (b) between clusters of Streptococcus suis, and (c) between isolates of S. suis within clusters. (a) A cladogram of our 31 pairs of congeneric species, comprising a pathogen (red) and a nonpathogen (gray). Numbers refer to table 1 and suprageneric relationships are from (Zhu et al. 2019). (b) A core genome phylogeny of our 1,079 isolates of S. suis. Individual disease (red) and carriage (gray) isolates are indicated in the inner strip. The outer strip describes the 34 genetic clusters, with the 11 “mixed clusters” that include multiple disease and carriage isolates numbered. (c) An illustrative phylogeny of our largest and most pathogenic cluster, constructed from a recombination-stripped local core genome alignment. Individual disease (red) and carriage (gray) isolates are again indicated on the strip.

