Fig. 1.
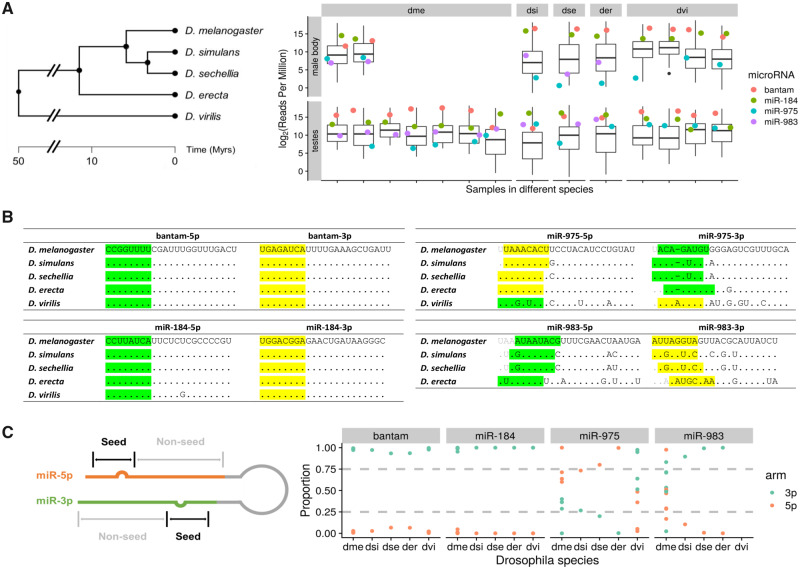
Sequence and expression divergence of miR-975 and miR-983 in Drosophila species. (A) The phylogenetic tree of five Drosophila sibling species is shown on the left. Adopted from TimeTree (Kumar et al. 2017), scale in million years (My). Expression levels (reads per million, RPM) of miR-975 and miR-983 in testes and male bodies are shown on the right. Boxplot represents the expression level of all detected miRNAs, and dots represent the expression of selected miRNAs annotated with different colors. miR-5p and miR-3p expression levels are summed together for comparison. dme, Drosophila melanogaster; dsi, D. simulans; dse, D. sechellia; der, D. erecta; dvi, D. virilis. (B) Sequences of two highly expressed conserved miRNAs, bantam and miR-184, across five Drosophila species are shown on the left. Sequences of miR-975 and miR-983 in the same species are depicted on the right. Seed regions of major and minor miRs are highlighted in yellow and green, respectively. (C) Arm switching of miR-975 and miR-983 in different Drosophila species. Relative expression levels of miR-5p and miR-3p are shown across species (right panel), with an annotation sketch of the miRNA structure (left panel).

