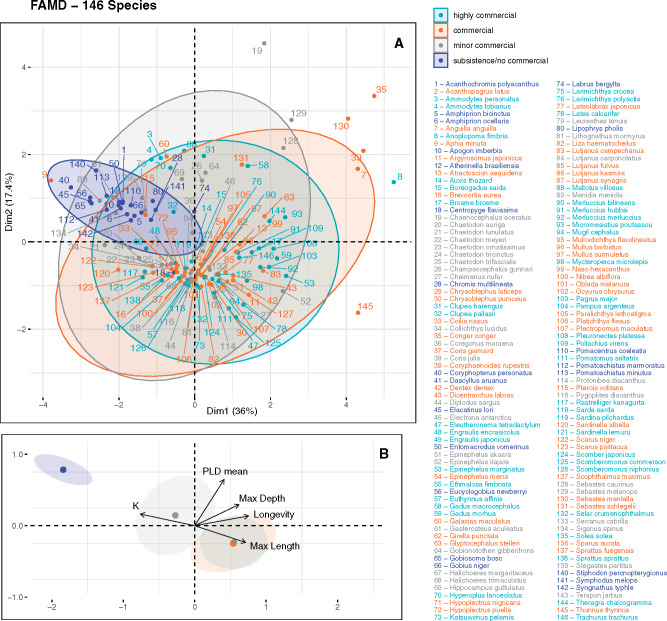
Fig. 2.
FAMD results based on the life-history traits of the analyzed species, color-coded per commercial importance. (A) Distribution of the included species within the two first principal components, together with concentration ellipses generated assuming multivariate normal distributions. The proportion of variation explained by each of the two principal components is indicated on both axes. (B) Contribution of quantitative variables and commercial importance clusters using 95% confidence intervals around group means.

