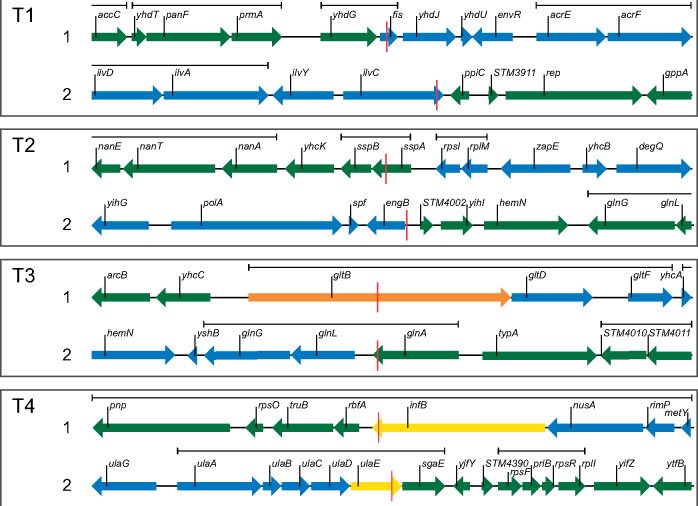
Fig. 2.
Analysis of recombination junctions. Chromosome structure around each recombination junction in a 10-kb window for hybrids T1–T4. S. Typhimurium genes are shown in green and Escherichia coli genes are shown in blue. Genes with a hybrid coding sequence are colored based on their protein identity. Hybrid genes that encode proteins identical to the protein in either species are shown in green or blue, genes with a protein identity >99% to either species are shown in yellow, and genes with a protein identity <99% to either species are in orange. The red line indicates the first nucleotide that does not match the Salmonella typhimurium sequence. Operon membership as indicated by the EcoCyc database (Keseler et al. 2017) is indicated above the genes. Junctions in hybrid strains K1–K4 and R1–R6 are shown in supplementary figure S5, Supplementary Material online.

