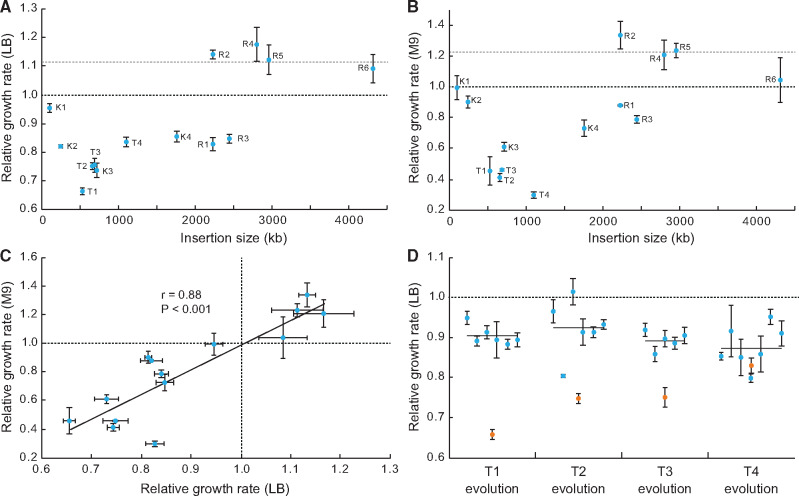
Fig. 3.
Growth rate analysis of hybrid strains. Relative growth rate of the fourteen hybrids as a function of insertion size in rich (A) and minimal (B) growth medium. (C) Correlation of relative growth rate in rich and minimal medium for all hybrids. (D) Relative growth rate of evolved (blue) and unevolved parental (orange) hybrids T1–T4. The black line indicates the average relative growth rate of the evolved hybrids. Error bars in each panel display the standard deviation of four independent measurements. The dashed lines indicate the relative fitness of the parental recipient Salmonella strain (black, defined as 1) and the donor Escherichia strain (gray).

