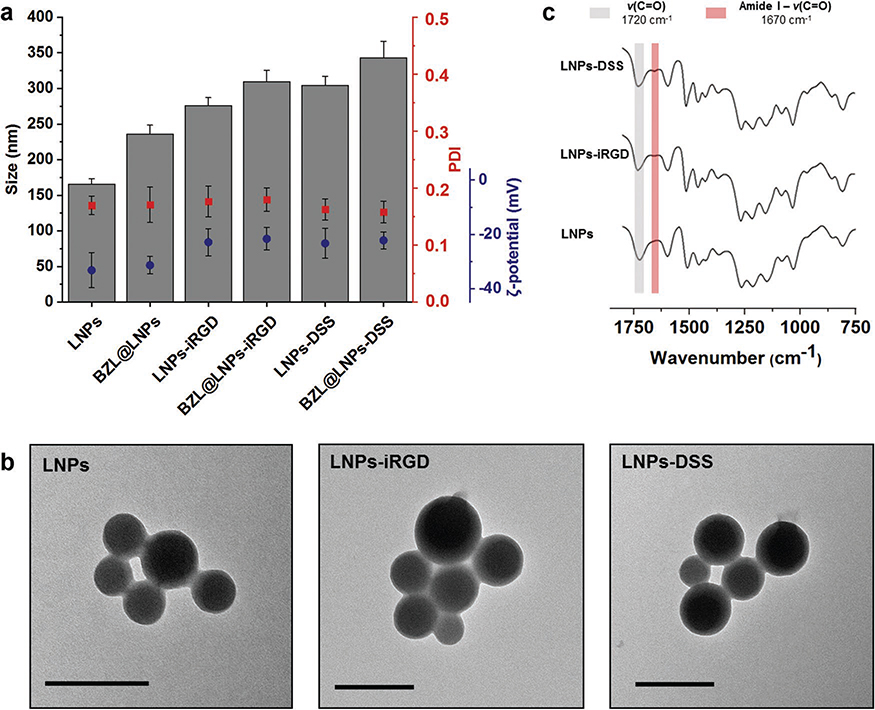
Figure 2.
Characterization of bare and BZL-loaded LNPs, before and after functionalization with iRGD and DSS by a) measuring average size, PDI, and ζ-potential of the LNPs, b) TEM images of the empty LNPs (scale bars are 200 nm), and c) ATR−FTIR spectra of the bare and functionalized LNPs. Error bars represent the mean ± s.d. (n ≥ 3).

