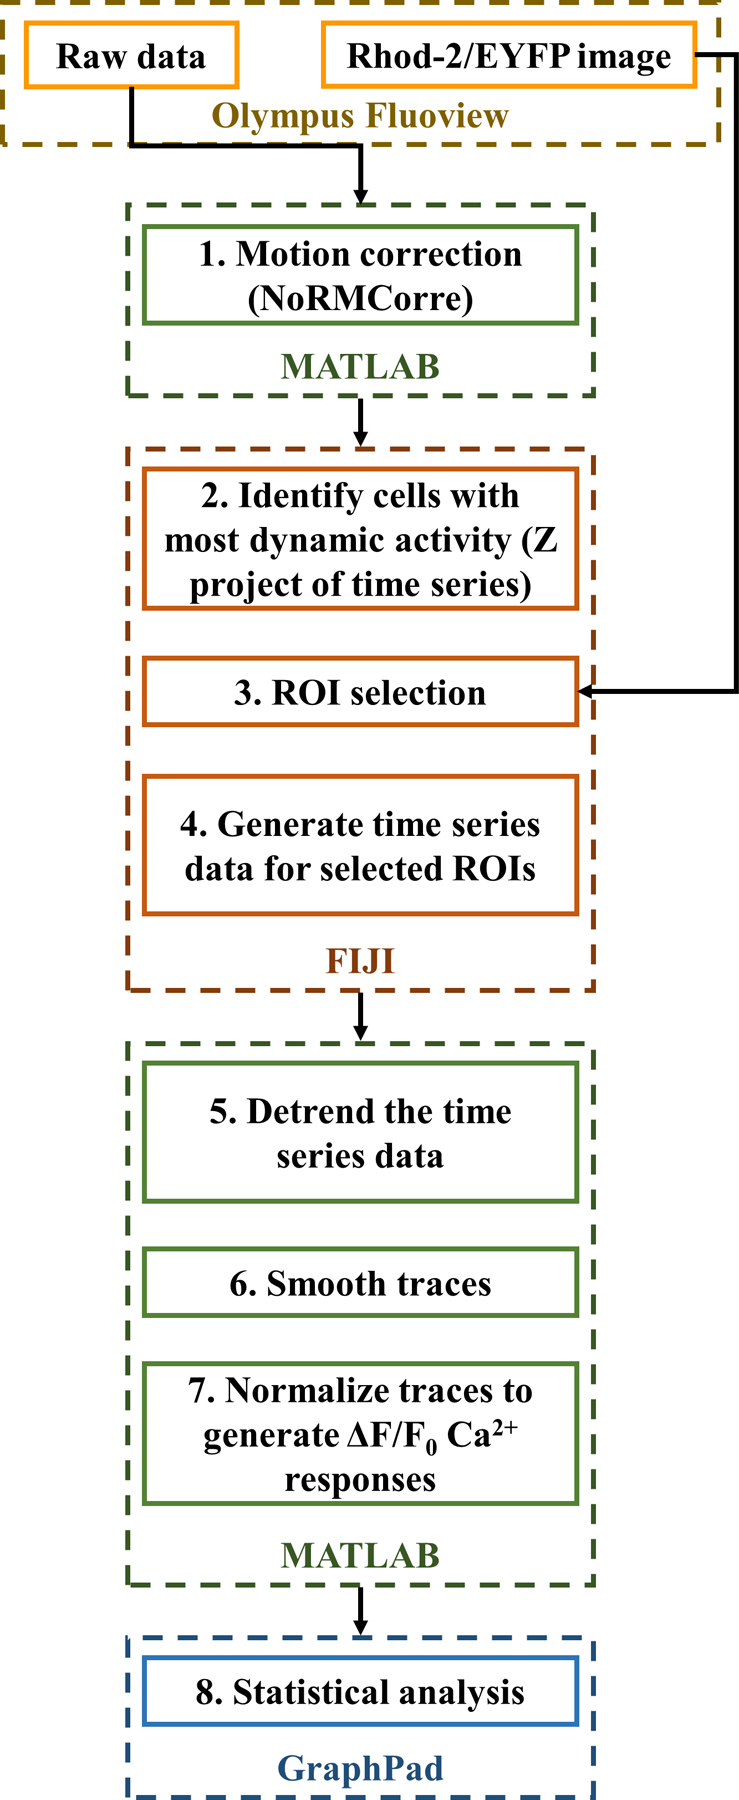
Figure 2.

Flowchart for processing 1-photon Ca2+ imaging data. Suggestive data processing pipeline for Ca2+ imaging time-lapse data. After acquiring data using the microscope software (e.g., Olympus Fluoview), the data is motion corrected in MATLAB, time series plots are generated on FIJI and further detrended, smoothed and normalized on MATLAB. GraphPad was employed to perform statistical analysis of the data.
