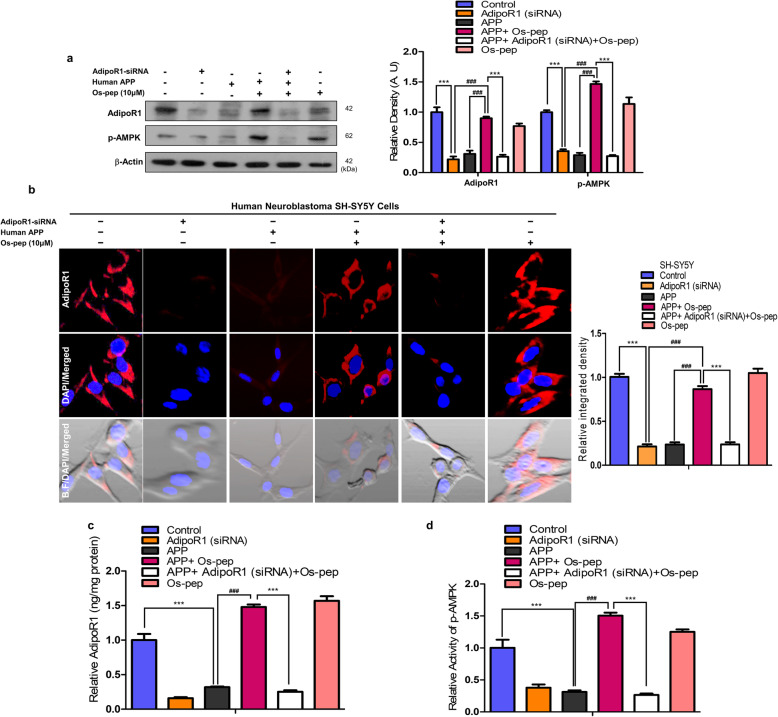
Fig. 2.
Os-pep stimulated AdipoR1/p-AMPK signaling in in vitro AD models. (a) Immunoblotting and quantification of AdipoR1 and p-AMPK levels in human APPswe/ind-overexpressed SH-SY5Y cells transfected with the AdipoR1 siRNA and treated with Os-pep (10 μM). The data are expressed as the means ± SEM for the indicated proteins in vitro (n = 5/group), and the number of independent experiments = 3. Significance = ***p < 0.001; ###p < 0.001; Two-way ANOVA followed by Bonferroni’s multiple comparisons test (b) Immunofluorescence reactivity for AdipoR1 (Red: TRITC and Blue: DAPI, Brightfield; B.F.) in human APPswe/ind-overexpressed SH-SY5Y cells transfected with the AdipoR1 siRNA and treated with Os-pep (10 μM). Magnified 40X. Scale bar = 20 μm. The data are indicated as the ± SEM for n = 5 images per group, and the number of independent experiments = 3. Significance = ***p < 0.001; ###p < 0.001; Two-way ANOVA followed by Bonferroni’s multiple comparisons test (c, d) Histograms present ELISA and immunoassay results for the AdipoR1 and AMPK levels respectively, in vitro cell lysates of human APPswe/ind-overexpressed SH-SY5Y cells expressing the AdipoR1 siRNA in the presence or absence of the Os-pep dosage (10 μM) for 12 h. The data are expressed as the means ± SEM for the indicated proteins in vitro (n = 5/group), and the number of independent experiments = 3. Significance = ***p < 0.001; ###p < 0.001; Two-way ANOVA followed by Bonferroni’s multiple comparisons test

