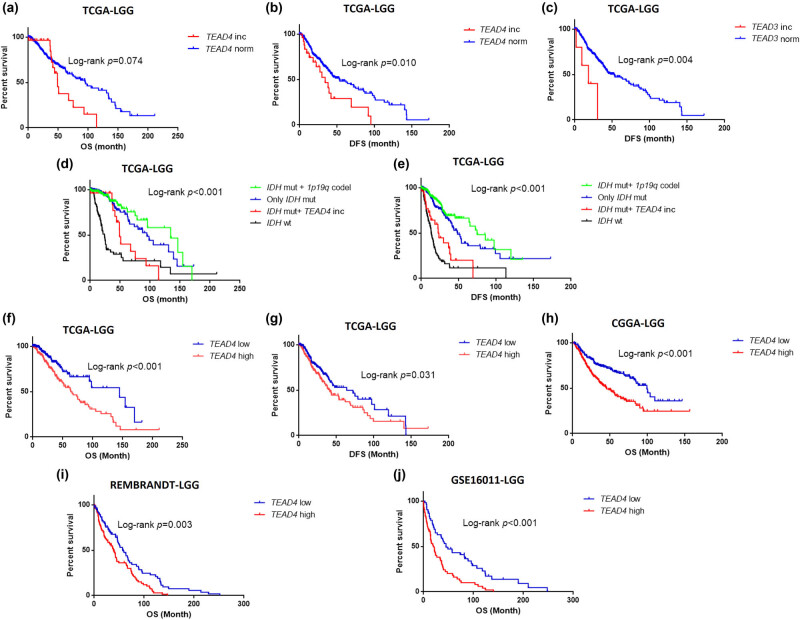
Figure 2.
Survival curve of TEAD3 and TEAD4 in patients with LGG. (a)–(e) Survival curve for CNVs (TEAD3 and TEAD4) in TCGA-LGG cohort. (f)–(j) Survival curve for TEAD4 expression. Blue lines represent gene normal copy number (norm) or TEAD4 low expression, and red lines represent gene copy number increase (inc) or TEAD4 high expression. OS means overall survival and DFS means disease-free survival.

