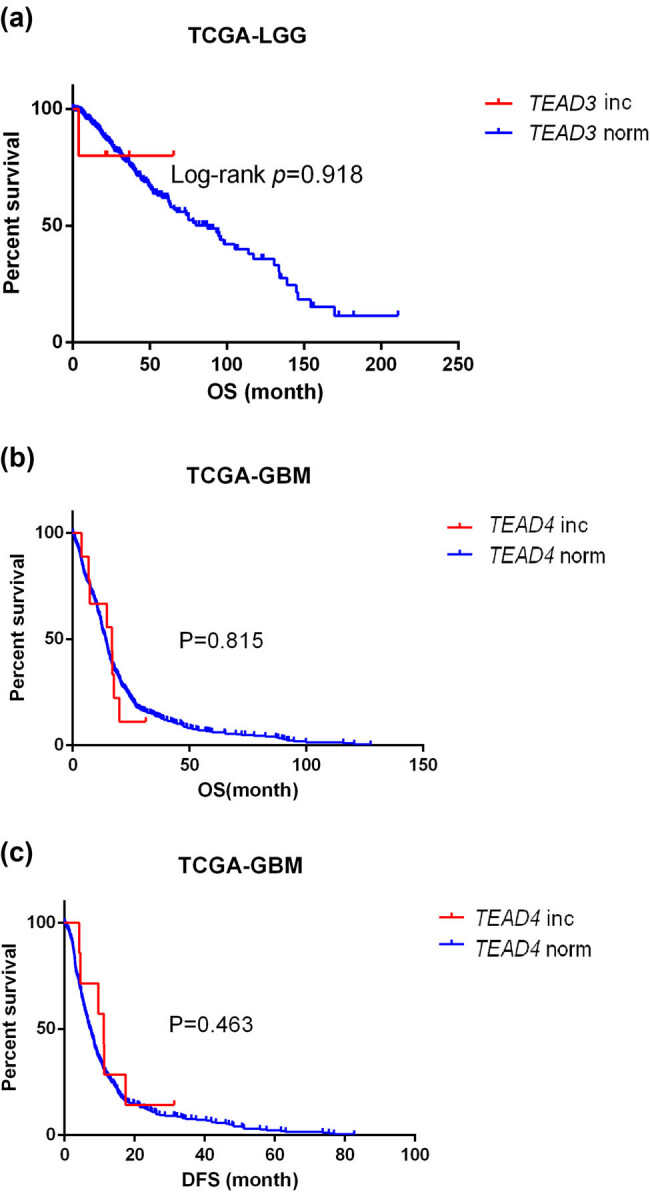
Figure A1.

Survival Curve of TEAD3 and TEAD4 CNV in patients with glioma. (a) Overall survival curve for TEAD3 CNV in TCGA-LGG cohort. (b) Overall survival curve for TEAD4 CNV in TCGA-GBM cohort. (c) Disease-free survival curve for TEAD4 CNV in TCGA-GBM cohort. Blue lines represent gene normal copy number (norm), while red lines represent gene copy number increase (inc). OS means overall survival, and DFS means disease-free survival.
