Figure A2.

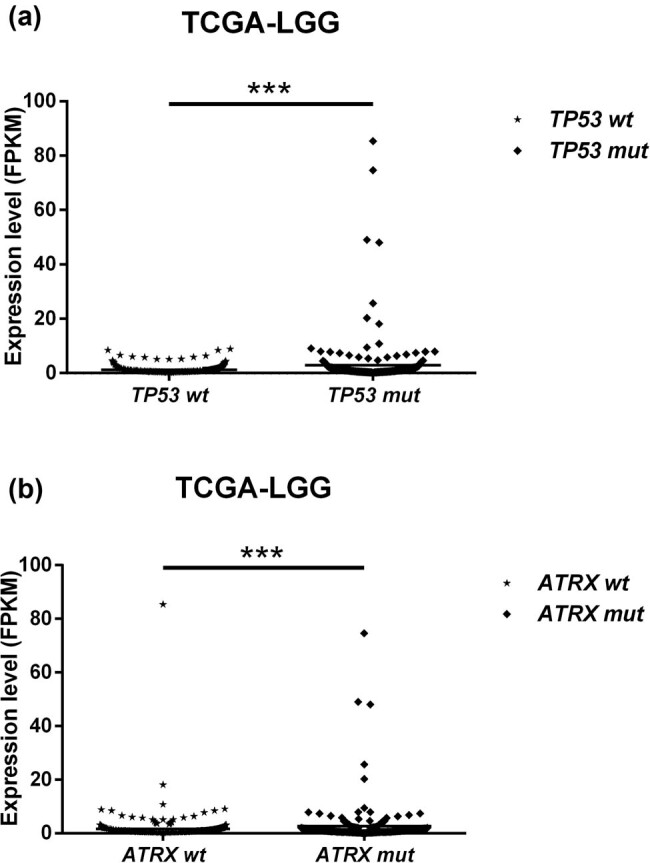
Distribution of TEAD4 expression according to TP53 mutation and ATRX mutation. mut represents mutation, wt represents wild type, FPKM means the expression data were normalized by FPKM method.

Distribution of TEAD4 expression according to TP53 mutation and ATRX mutation. mut represents mutation, wt represents wild type, FPKM means the expression data were normalized by FPKM method.