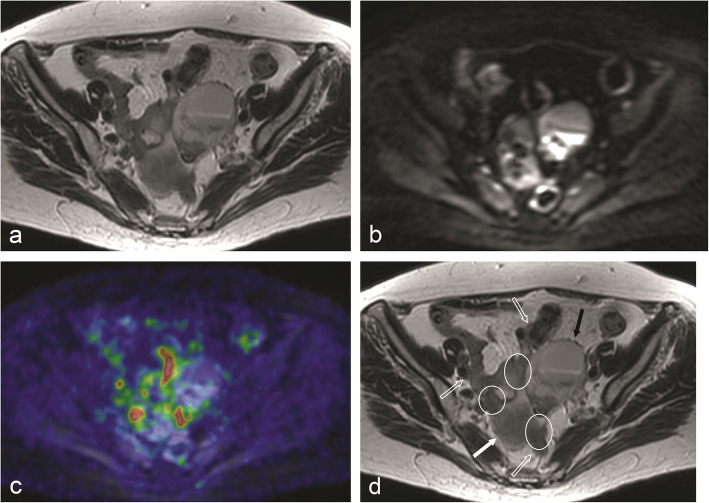
Fig. 3.
This FSE T2-w image (a) illustrates the difficulty in discriminating the different structures that contribute to form the complex image seen in the center of the pelvis. There are areas of restricted diffusion in DWI b = 1000 (b) which do not correspond to areas of increased FDG uptake as showed in this fused PET/MR image (c). The image was interpreted as being formed by a cystic ovarian tumor (solid black arrow), bowel loops (open arrows), peritoneal carcinomatosis (encircled) and fundus uteri (solid white arrow) (d). The exact localization of peritoneal implants, if they were on bowel surface or on the surface of pelvic peritoneum, was very difficult, as was to say if the loops corresponded to ileum or sigmoid colon. PCI for “Pelvis”, or “region 7”, was 3 for surgery, 0 for MRI alone (DWI) and 3 for PET/MR, thus a false negative for MRI and true positive for PET/MRI

