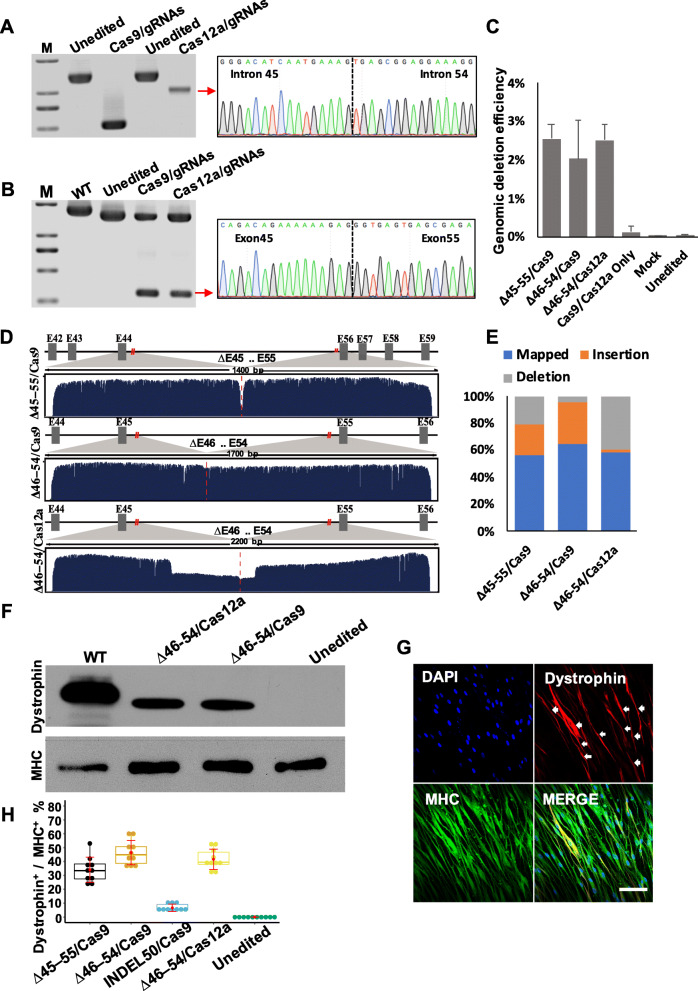
Fig. 4.
CRISPR/Cas12a -induced rescue of dystrophin expression. a PCR analysis of dystrophin expression in DMD–MDSCs targeted by Cas9/gRNA or Cas12a/gRNA specific to introns 45 and 54, respectively. All detected bands were of the expected size; the band indicated by a red arrow was verified by Sanger sequencing, which confirmed the junction of segmental introns 45 and 54. M, marker. b RT-PCR analysis of dystrophin expression in myotubes differentiated from the DMD–MDSCs targeted by Cas9/gRNA or Cas12a/gRNA, as shown in a. All detected bands were of the expected size; the band indicated by a red arrow was verified by Sanger sequencing, which confirmed the junction of exons 45 and 55. M, marker. c The editing efficiency of three large-scale excision strategies indicated by ddPCR assays. d Nanopore sequencing reads from edited MDSCs mapped at the spliced DMD genome; cut sites were marked by red lines. E, exon. e The base mutation percentage around the cut sites (40 bp for ∆45–55/Cas9, 65 bp for ∆46–54/Cas9 and ∆46–54/Cas12a). f Western blot analysis of dystrophin expression in targeted (∆46–54/Cas9 and ∆46–54/Cas12a) or untargeted myotubes differentiated from the DMD–MDSCs; WT MDSCs served as a positive control. Expected molecular weights were 427 kDa for WT and 375 kDa for Cas9/∆46–54 and Cas12a/∆46–54. MHC served as a loading control. g Representative images of MHC (green) and dystrophin (red, white arrow) expression in Cas12a/∆46–54-targeted myotubes differentiated from the DMD–MDSCs as determined by immunocytochemistry; nuclei were stained with DAPI (blue). Scale bar, 100 μm. h Representative box plots of the efficiency of the different gene-editing strategies in vitro as indicated by the ratio of the number of dystrophin-positive fibers (dystrophin+) to that of MHC-positive fibers (MHC+); ∆46–54/Cas9, ∆46–54/ Cas12a, and ∆45–55/Cas9 showed higher efficacy than INDEL50/Cas9 (P < 0.05, n = 10)

