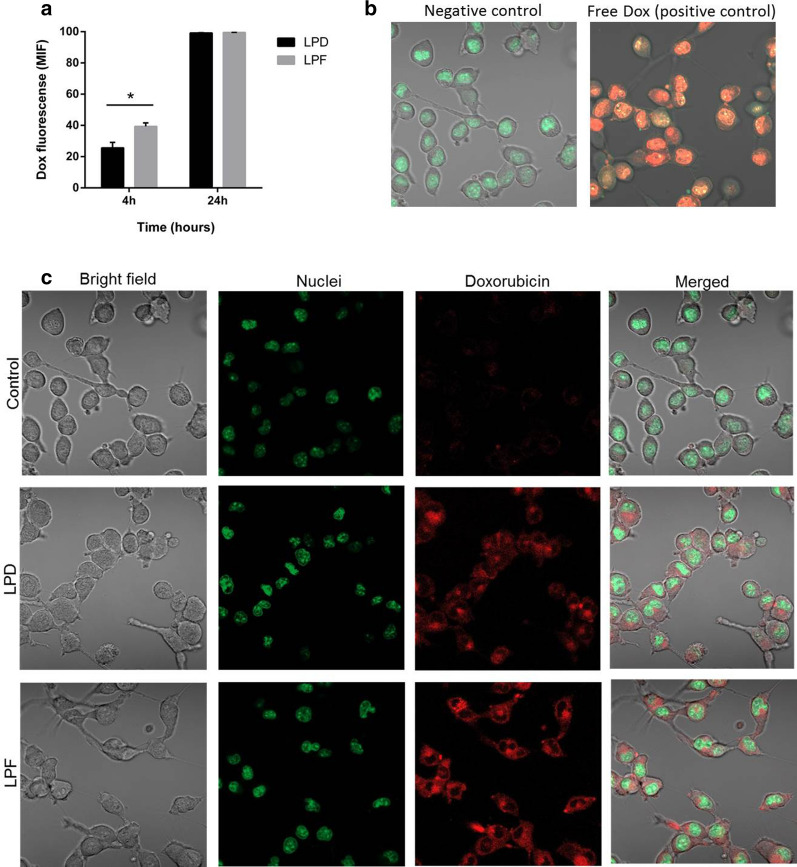
Fig. 2.
Doxorubicin fluorescent signal in B16OVA cells exposed to liposomes. a Fluorescent signal measured by flow cytometry after 4 and 24 h incubation with LPD and LPF. Bars represent the mean ± SD of three independent studies. b Confocal microscopy images of positive (free Dox treatment) and negative (untreated) controls; c Cellular images after 4 h exposure to LPD and LPF. The fluorescent signals: red for Dox and green for the nuclei. Dox: doxorubicin; LPD: conventional Dox liposomes; LPF: targeted Dox liposomes; MIF: mean intensity fluorescence signal

