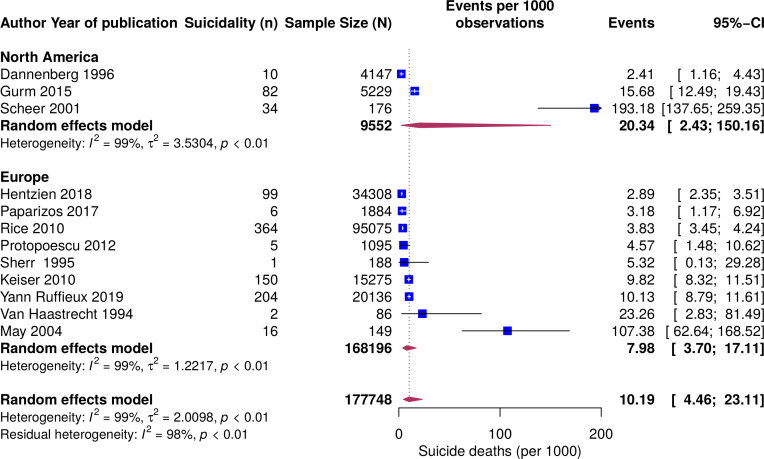
Figure 2.
Forest plot of the incidence of suicide deaths per 1000 PLWHA by continent from random-effects model: event values represent the number of suicide deaths per 1000 PLWHA (95%CI). Blue squares and their corresponding lines are the point estimates and 95%CIs per study. Maroon diamonds represent the pooled estimate of the prevalence for each subgroup (width denotes 95%CIs). Heterogeneity by continent: North America (I2=99%); Europe (I2=99%); p value for the interaction comparing the different subgroups is 0.41. PLWHA, people living with HIV/AIDS.

