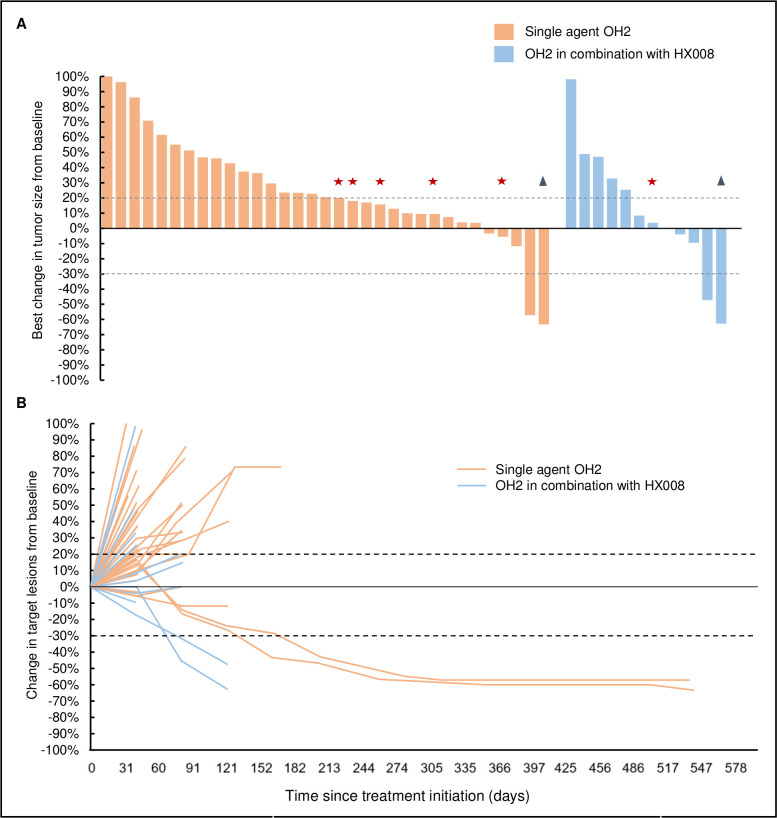
Figure 1.
Response to the study treatment. (A) Waterfall plot showing best percentage change in target lesions from baseline. The stars indicate patients with new lesions despite stable target lesions; the triangles indicate patients having pseudo-progression before achieving immune-partial response. (B) Chronological change of target lesions from baseline.

