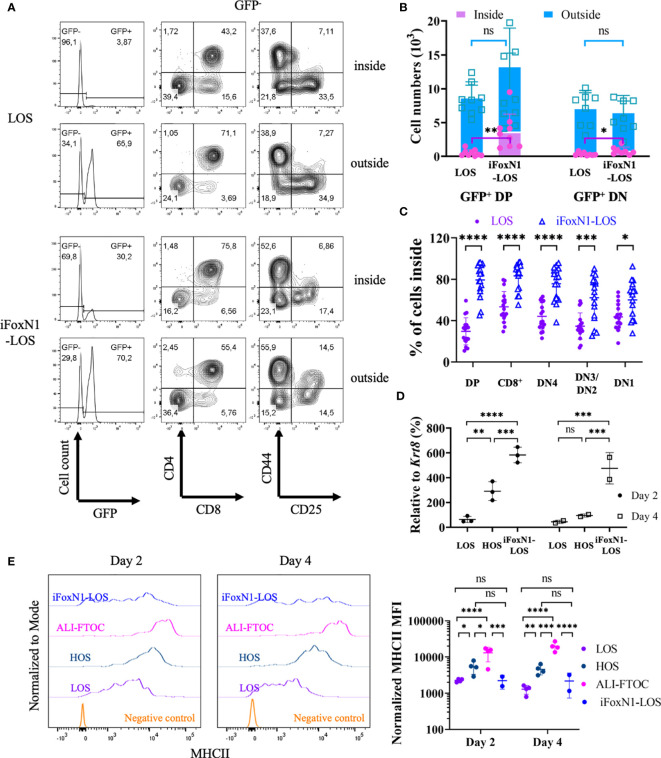
Figure 5.
Migration of CD4+CD8+ cells in LOS cultures. (A) Flow cytometric analysis of cells inside and outside of lobes from LOS- and iFoxN1-LOS-FTOCs. Sorted GFP-expressing CD4+CD8+ cells were added to LOS-FTOCs and all cells were analyzed after 1-day of culture. The left panels show histograms of GFP expression from CD45+γδTCR− gated cells. The middle and right panels show CD4 and CD8 expression on CD45+γδTCR−GFP− cells, and CD44 and CD25 expression on CD45+γδTCR−GFP−CD4−CD8− cells, respectively. (B) Stacked column graphs and statistical analysis (unpaired Student’s t-test) of numbers of added GFP+ CD4+CD8+ (DP), or CD4−CD8− DN2/DN3 (DN) cells, inside and outside of lobes after 1-day of culture, as indicated. (C) Scatter dot plots and statistical analysis (unpaired Student’s t-test) of percentage (%) of endogenous (GFP-) cells in different subsets that remained inside of the lobes after 1-day of culture, as indicated. (D) Scatter dot plots and statistical analysis (two-way ANOVA with post-hoc Tukey’s test) of Ccl25 transcript levels relative to keratin 8 (Krt8) quantified by RT-qPCR, as indicated. (E) Flow cytometric analysis of MHCII expression on TECs from LOS-, HOS-, ALI-, and iFoxN1-LOS-FTOCs. Representative histogram overlays and statistical analysis (two-way ANOVA with post-hoc Tukey’s test) of MHCII levels on day 2 and day 4 of cultures are shown, as indicated. Samples were pre-gated on CD45-EpCam+ cells except for negative control, which were CD45+ cells. ns, not significant; p > 0.05; *p < 0.05; **p < 0.01; ***p < 0.001; ****p < 0.0001.

