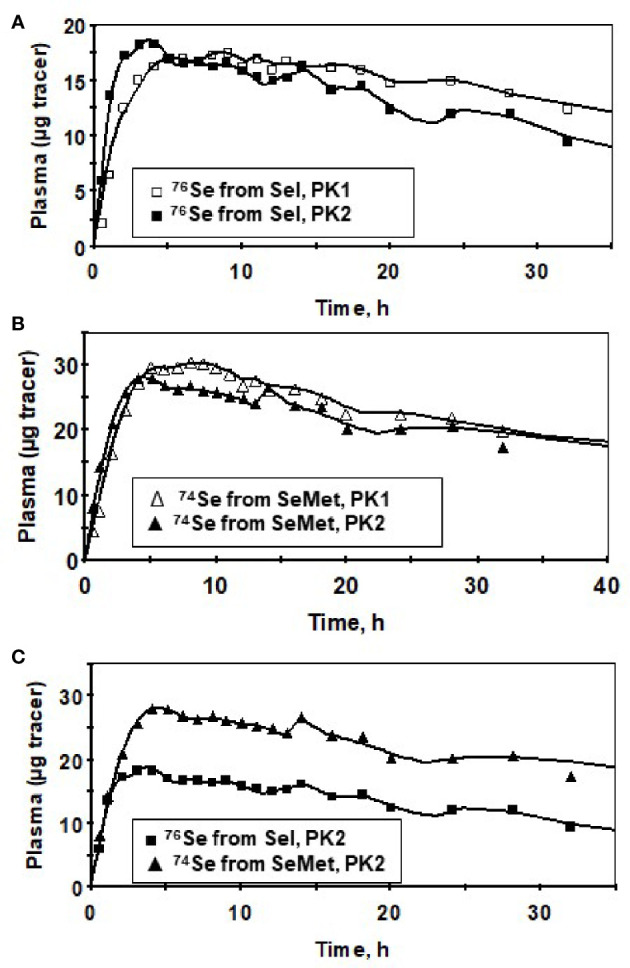
Figure 2.

Tracer data for a male subject for Sel (76Se-Sel) before (PK1, ▯), and after (PK2, ◼) Se supplementation (A), SeMet (74Se -SeMet) in plasma for PK1 (∆) and PK2 (▲) (B) and for SeMet (▲) versus Sel (◼) for PK2 showing similar timing of the peaks between the forms (C) for the first 40 h after isotope administration. Symbols are observed values; lines are model-calculated values ( Supplemental Figure 1 ).
