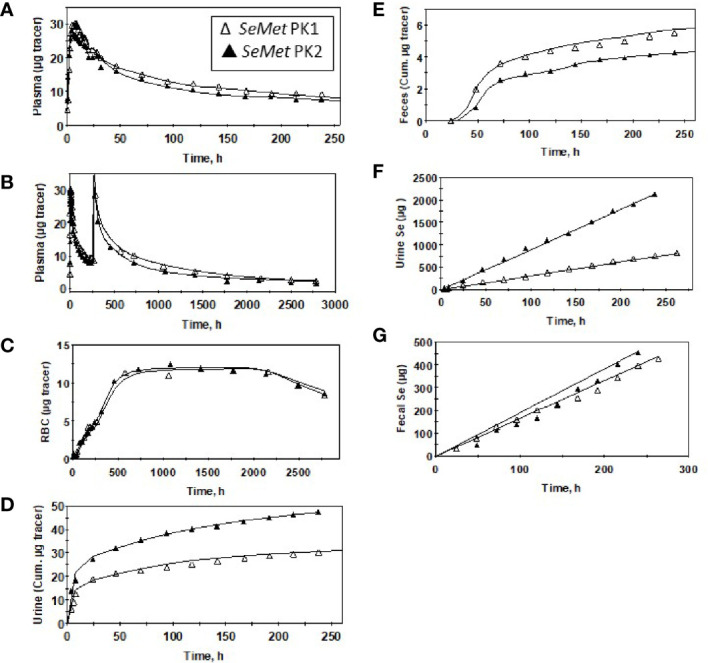
Figure 3.

Observed data (∆,▲) and model-calculated ( Supplemental Figure 1 ) values (solid lines) for a male subject before (PK1, ∆) and after (PK2, ▲) Se supplementation for SeMet (from 74Se -SeMet) in plasma for 260 h (A) or 2,880 h (B) after tracer administration, RBC (C), urine (D), and feces (E); and total Se excreted in urine (F) and feces (G).
