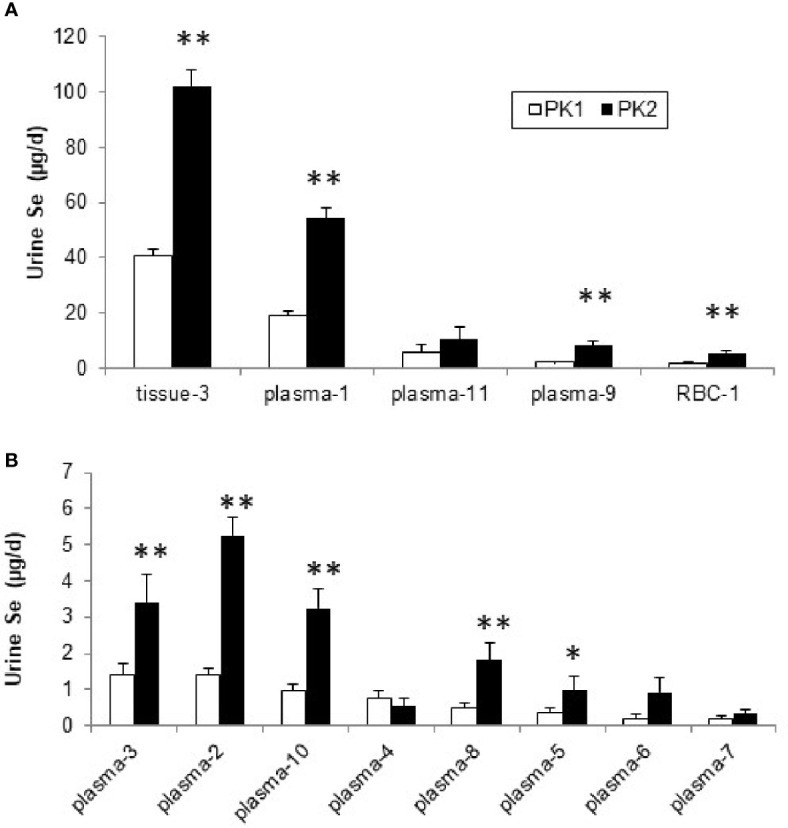
Figure 5.

Se (µg/d) excreted into urine from plasma, RBC, and tissue pools before (PK1) and after Se supplementation (PK2) estimated using the model in Supplemental Figure 1 , for pools with higher excretion rates (A) and those with lower rates (<10 µg/d), (B). *Differences are significant for PK2 vs. PK1 (P < 0.05), or **(P < 0.01).
