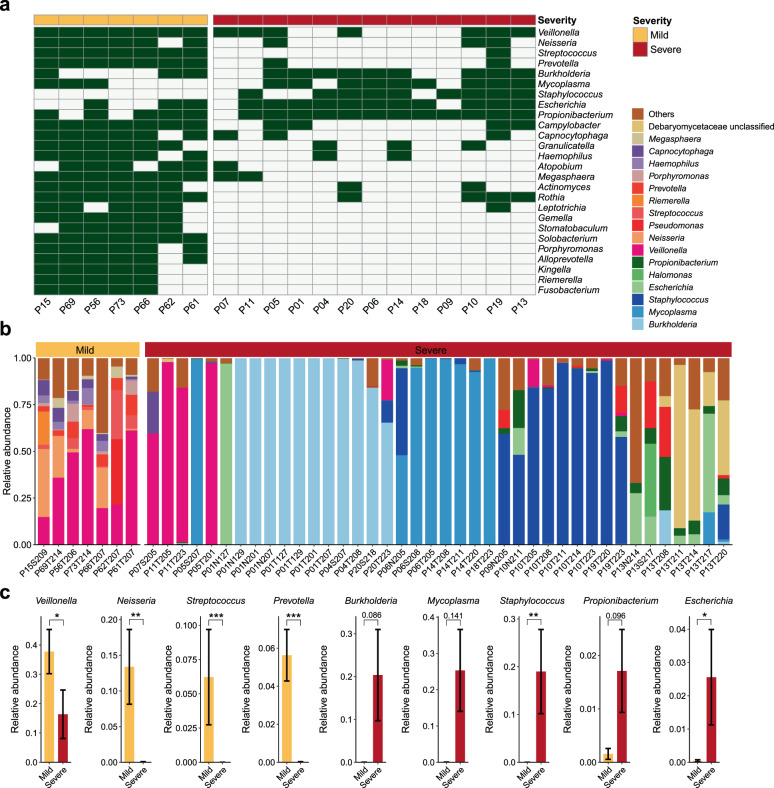
Fig. 2. Distinct respiratory microbial signatures in mild and severe cases.
a Presence/absence profile of nonviral microbial genera in mild and severe cases. Orange, mild; brick red, severe. Only common genera detected in over 60% of patients in the mild cases (n > 4) or severe cases (n > 7) are shown. b Bar plot showing the relative expression levels of nonviral microbes in all respiratory specimens of mild (orange, n = 7) and severe cases (brick red, n = 40). c Relative expression levels of selected genera differing between mild and severe cases. The bar chart and black error bars denote the mean and standard error values of expression levels in mild (orange) and severe (brick red) cases for each genus. ***P < 0.001; **P < 0.01; *P < 0.05; Wilcoxon rank-sum test. For patients with multiple respiratory specimens (all were severe cases), the presence of a given genus is considered when at least one sample from this patient was positive for the taxon (relative abundance > 0) (a), and the comparisons between relative expression levels of selected genera are conducted across all collected respiratory samples between mild and severe cases (c).

