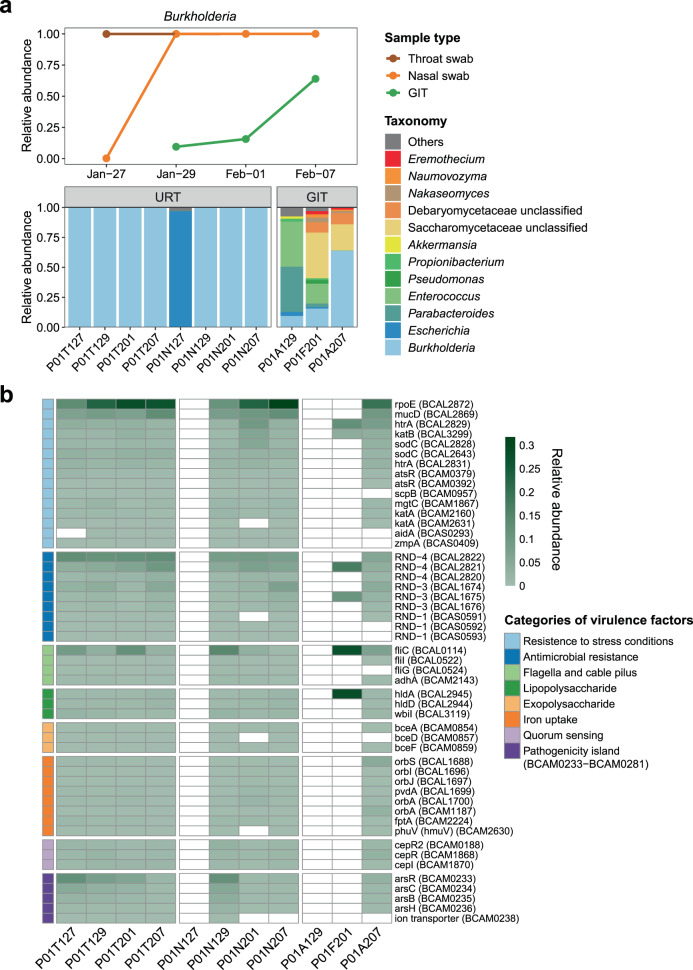
Fig. 3. Identification of the potential secondary B. cenocepacia infection in P01.
a Bar plot showing the relative expression levels of nonviral microbes in all specimens from P01. A timeline chart showing the corresponding changes in abundance of B. cenocepacia transcripts from 27 January to 07 February 2020 in P01. Brown indicates throat swabs; orange indicates nasal swabs and green indicates GIT samples including anal swabs and feces. A total of 11 specimens from the respiratory tract (RT) and gastrointestinal tract (GIT) are shown. Orange, fungi; blue, bacteria. b Heatmap showing the relative expression levels of virulence factors of B. cenocepacia. A total of 50 identified virulence genes are shown and ranked according to their functional categories: light blue, resistance to stress conditions; blue, antimicrobial resistance; light green, flagella and cable pilus; green, lipopolysaccharide; pink, exopolysaccharide; orange, iron uptake; light purple, quorum sensing; purple, genes located in a pathogenicity island.

