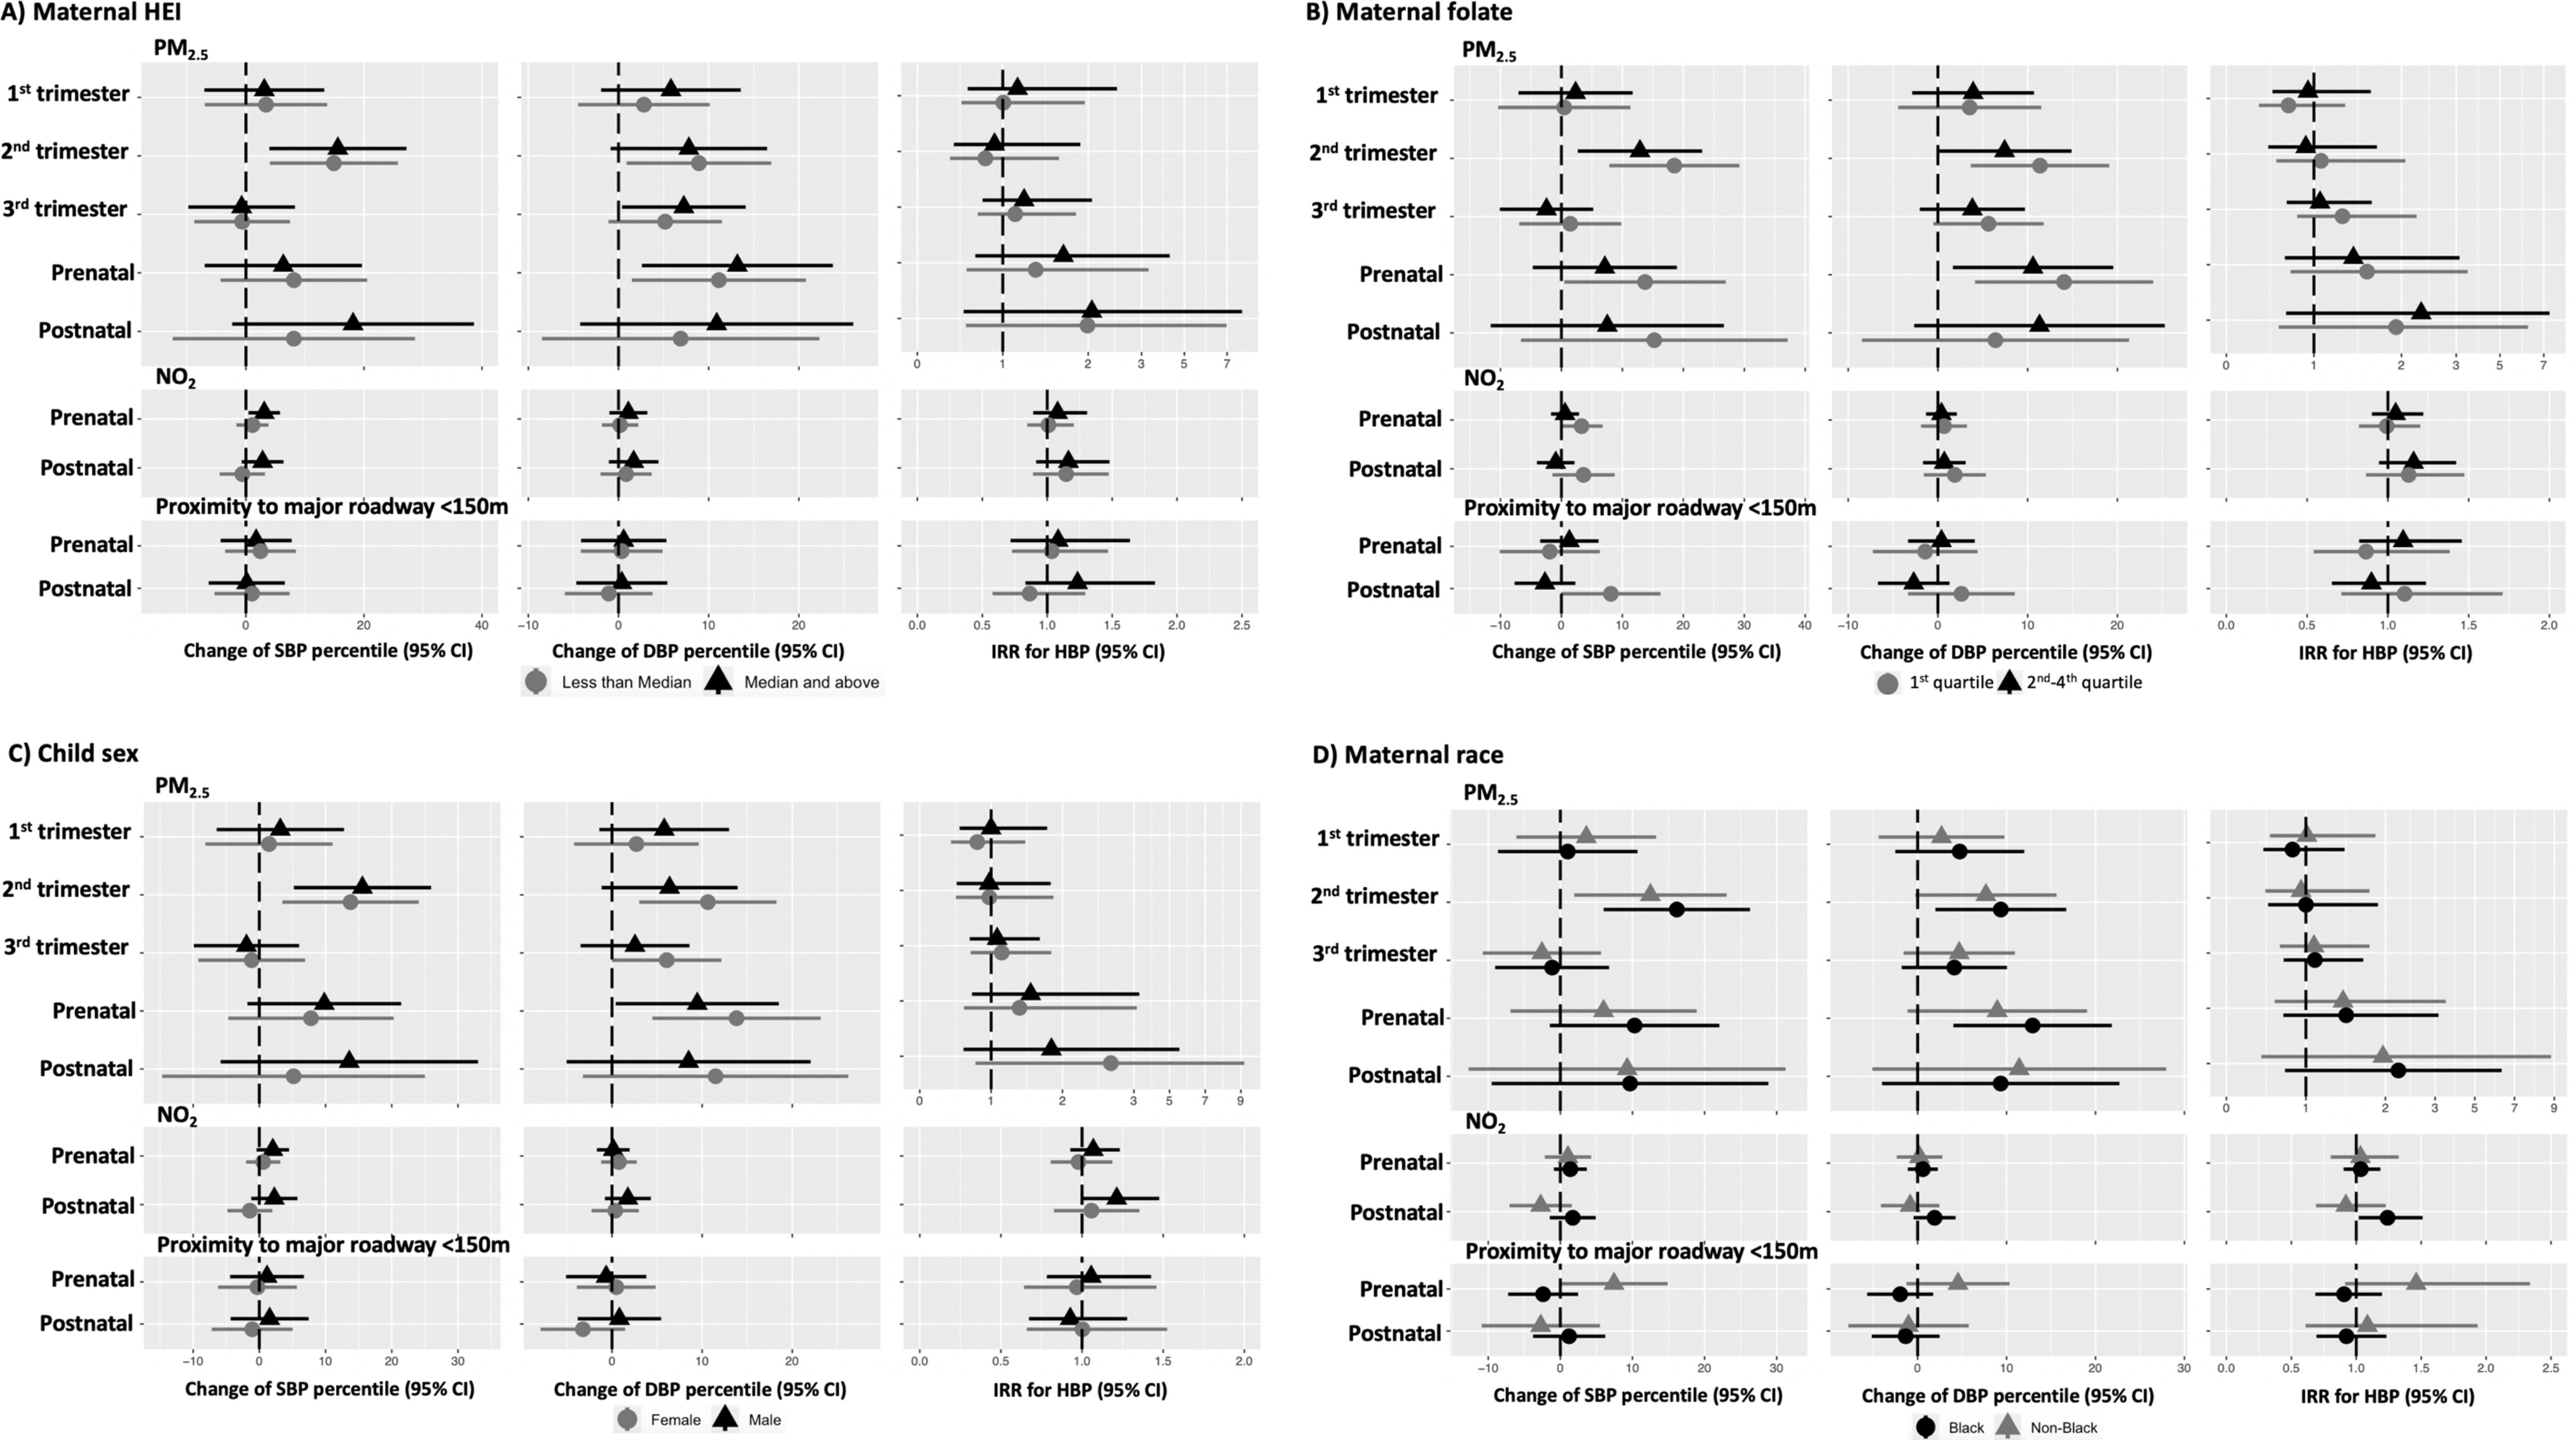
Figure 2.

Shown are estimated effects of air pollution exposures on BP percentiles and HBP by maternal HEI levels (), maternal plasma folate (first quartile vs. second to fourth quartile), child sex (female vs. male), and maternal race (Black vs. non-Black) from the interaction models. In addition to effect modifiers and interaction terms, the models (linear regressions for blood pressure percentiles and Poisson regressions for HBP) were controlled for child sex, child age and height at the age 4- to 6-y visit, study site, time splines of both visit date and date of conception (only for and ), maternal age at childbirth, maternal race, maternal education, income adjusted by household size, breastfeeding, urinary cotinine adjusted by specific gravity in the second trimester, BMI class before pregnancy, insurance status, maternal Global Severity Index, child sleep scores, child physical activity levels, child secondhand smoking exposures, child use of medication that potentially increased blood pressure, and Child Opportunity Indices. Visit date was universally modeled with 1 df/y in all models. Conception date was modeled with 1 df/y for analyses with and was modeled with varied df for in different windows: 8 df/y of conception date for trimester-specific , 4 df/y for prenatal , and 1 df/y for postnatal . There was no time adjustment for proximity to major roadway in all models. The symbols of triangles and circles indicate the effect estimate, the error bars show 95% confidence intervals, and the dotted lines show null values. Numeric data is shown in Table S6 and S7. Note: BMI, body mass index; BP, blood pressure; df, degrees of freedom; HBP, high blood pressure; HEI, Healthy Eating Index; , nitrogen dioxide; , ambient particulate matter (particulate matter in aerodynamic diameter).
