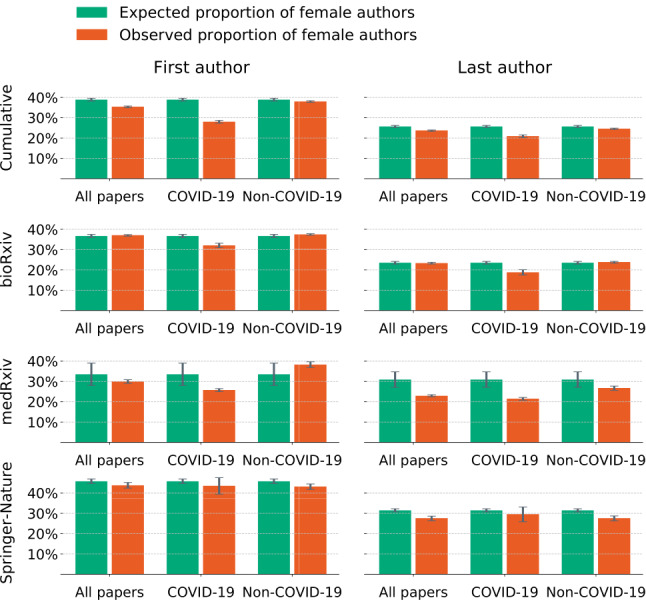
Figure 2.

Comparison of the expected and observed proportions of female authors that published during the COVID-19 pandemic. Green bars represent the expected proportion of female authors, estimated by the ordinary least squares model from the historical data from 2019. Orange bars represent the observed proportion of female authors that published during the COVID-19 pandemic. The standard errors of the aggregate analyses are represented as the vertical lines on top of the bars. The papers are divided by topic into three groups: (1) all papers from the data set, (2) papers that deal directly with COVID-19 and related topics, and (3) papers that are not about COVID-19 or related topics. The first row shows the results from all publishers combined. The following rows represent the results for each publisher separately.
