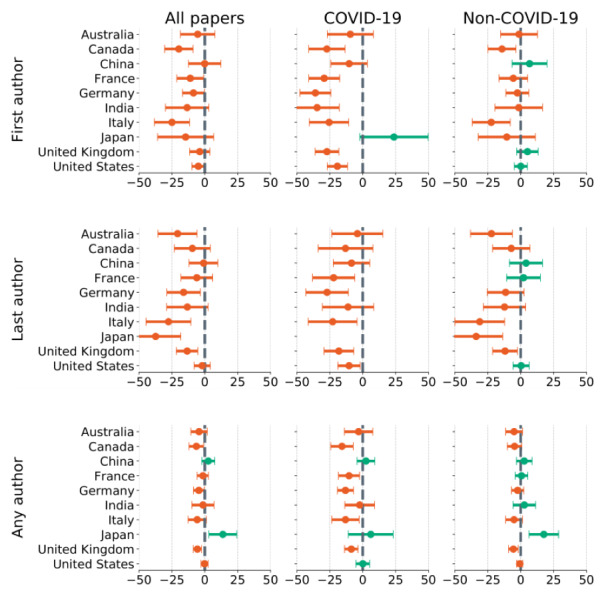
Figure 3.

Percentage drop in proportion of female authors during the pandemic across countries. Orange points mark the percentage decrease in proportion of female authors; green points mark the increase. Horizontal lines represent standard errors. The analysis is divided by topic into three groups: (1) all papers from the data set, (2) papers that deal directly with COVID-19 and related topics, and (3) papers that are not about COVID-19 or related topics. Missing points indicate insufficient sample size.
