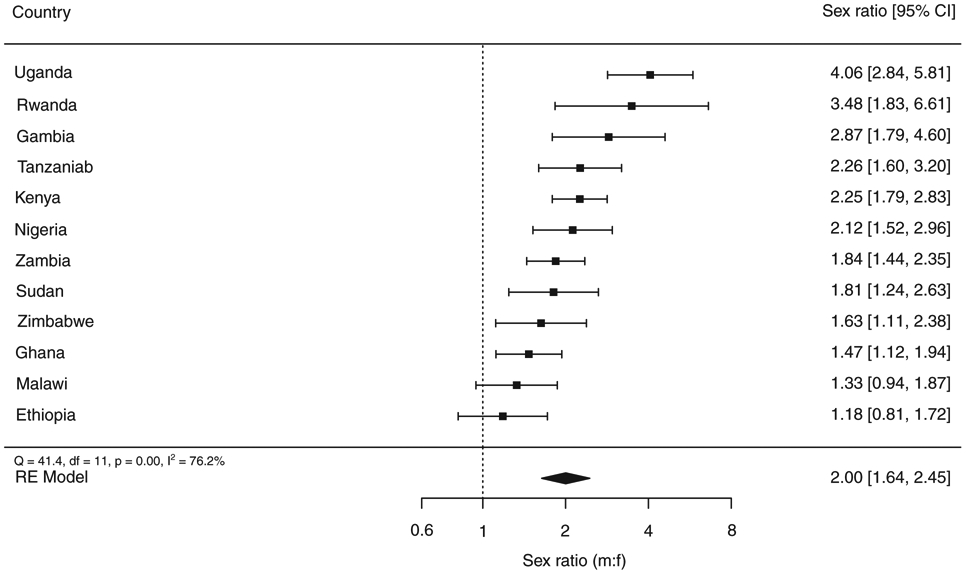
Figure 4.

a The size of the best estimate (black square) is proportional to the model’s weights (inverse variance).
b The sex ratio of smear-positive TB prevalence is shown for Tanzania.
The sex ratio (male to female) of bacteriologicallyconfirmed pulmonary TB cases detected in national TB prevalence surveys implemented in Africa, 2008–2016a.
