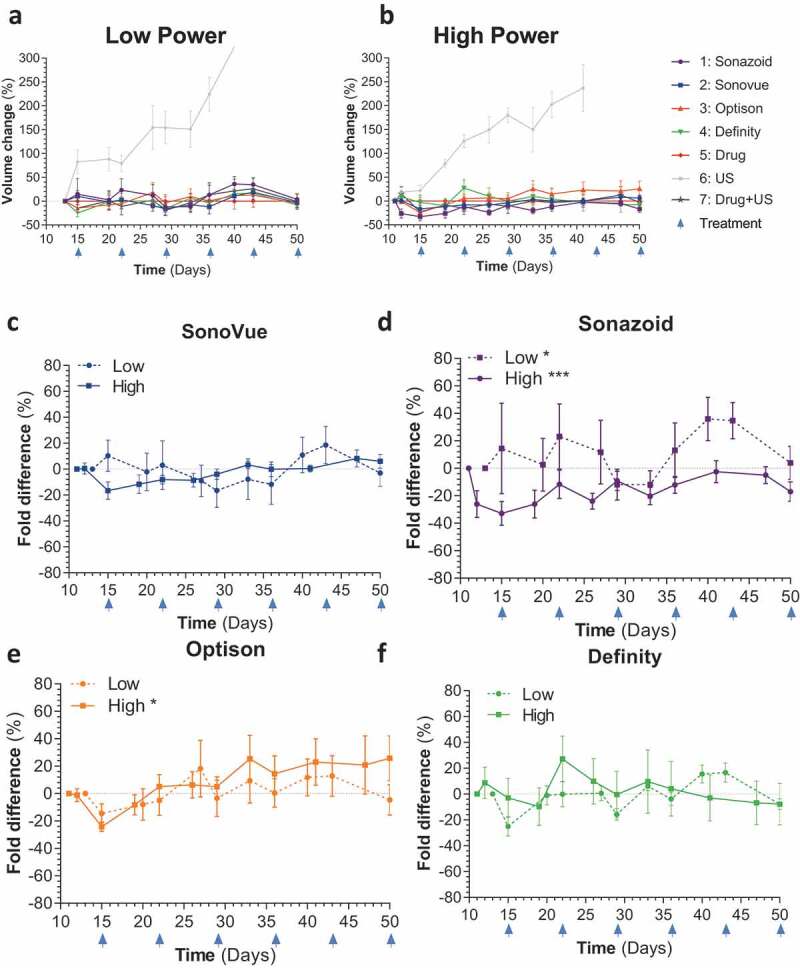
Figure 2.

Tumor growth for IV treated mice: A,B) Comparison of all treatment arms across low and high ultrasound power respectively C-F) Comparison of total tumor volume for ultrasound alone vs individual ultrasound contrast agents (SonoVue + drug + US, Sonazoid+ drug + US, Optison+ drug + US and Definity+ drug + US, respectively) against chemotherapy split by high and low ultrasound power settings
