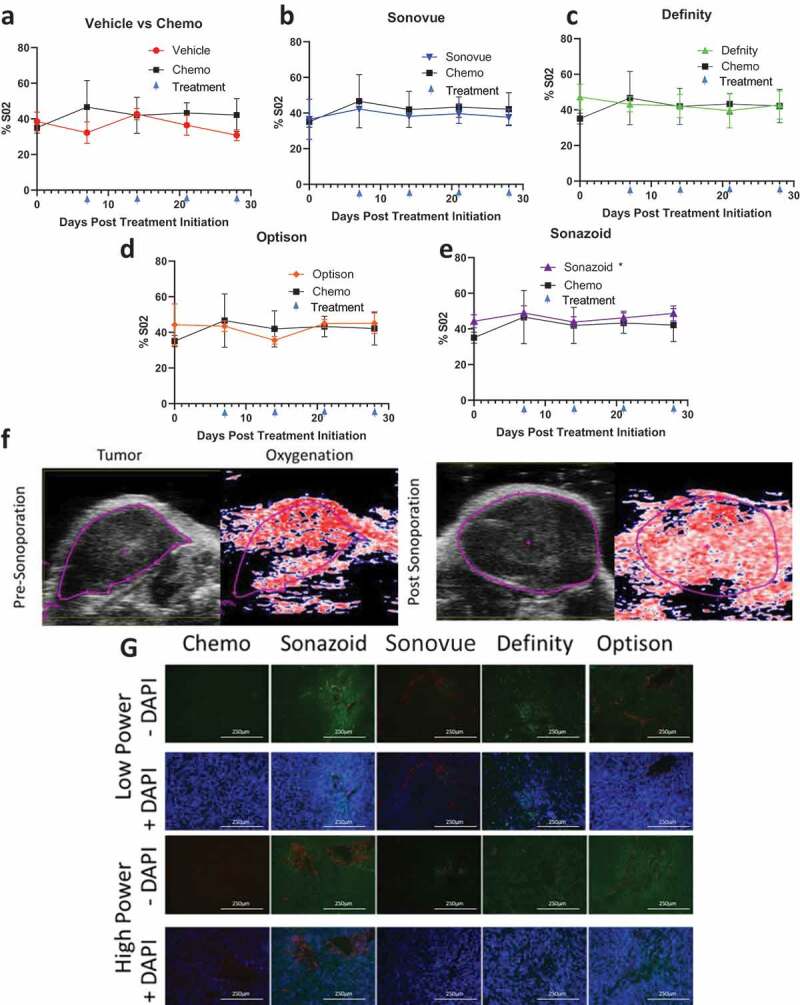
Figure 5.

Measures of tumor vascularity: A-E) Comparison of vehicle and individual ultrasound contrast agents against chemotherapy % total O2 in tumors split by high power settings F) Comparison of tumor oxygenation at baseline prior to sonoporation with Sonazoid in the high acoustic power cohort and after sonoporation treatment has been completed (4 weeks later just prior to sacking). This image depicts an overall increase in oxygenation from 49% to 53% within the imaging plane (and from 41% to 54% within the entire tumor volume of this animal). G) Tumors were stained with CD31 (red) staining epithelial cells, and counterstained with tomato lectin (green indicating endothelial cells) and DAPI staining (blue demonstrating cellularity)
