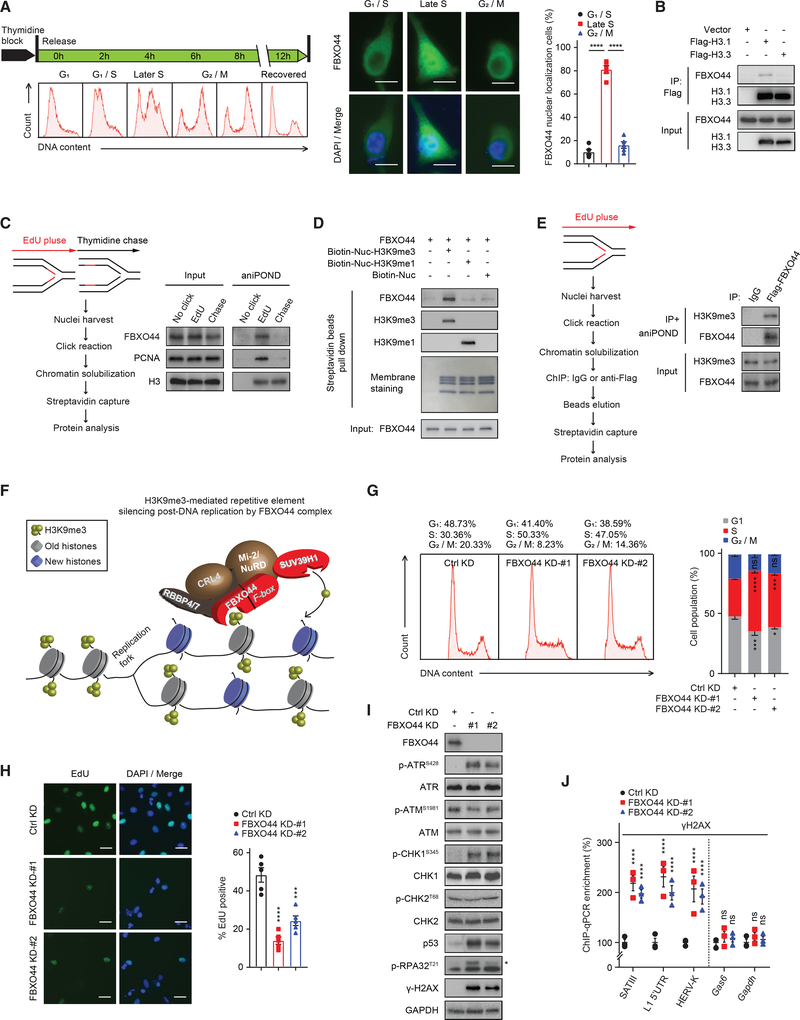
Figure 3. FBXO44 promotes RE silencing post-DNA replication.
(A) IF images of FBXO44 (middle panel) in HeLa cells synchronized at the indicated cell cycle phases (left panel). Scale bar, 10 μm. Quantification of cells with FBXO44 nuclear localization is shown (n = 5) (right panel).
(B) CoIP of endogenous FBXO44 with Flag-histone H3.1 or H3.3.
(C) aniPOND analysis of FBXO44 chromatin binding. Schematic of protocol (left panel) and immunoblots of FBXO44, DNA replication fork protein PCNA, and histone H3 (control) are shown (right panel).
(D) In vitro binding assay using recombinant FBXO44 and H3K9me1−, H3K9me3−, or un-modified nucleosomes.
(E) aniPOND analysis of FBXO44 binding to H3K9me3-modified nucleosomes. Schematic of protocol (left panel) and immunoblots are shown (right panel).
(F) Model of FBXO44 regulation of H3K9me3-mediated RE silencing post-DNA replication.
(G) Flow cytometry analysis of cell cycle (left panel) and quantification (n = 3) (right panel).
(H) IF images of EdU incorporation in DNA of MDA-MB-231 cells (left panel) and quantification (n = 5) (right panel). Scale bar, 20 μm.
(I) Immunoblots of DNA replication checkpoint and DNA damage response (DDR) proteins. *p-RPA32T21.
(J) ChIP analysis of γH2AX levels at the indicated REs (n = 3).
Data represent mean ± SEM. ns, not significant; *p < 0.05, ***p < 0.001, ****p < 0.0001 by one-way ANOVA followed by Tukey’s multiple comparisons test (A), Dunnett’s multiple comparisons test (H), and two-way ANOVA followed by Dunnett’s multiple comparisons test (G), Tukey’s multiple comparisons test (J).
See also Figure S3.

