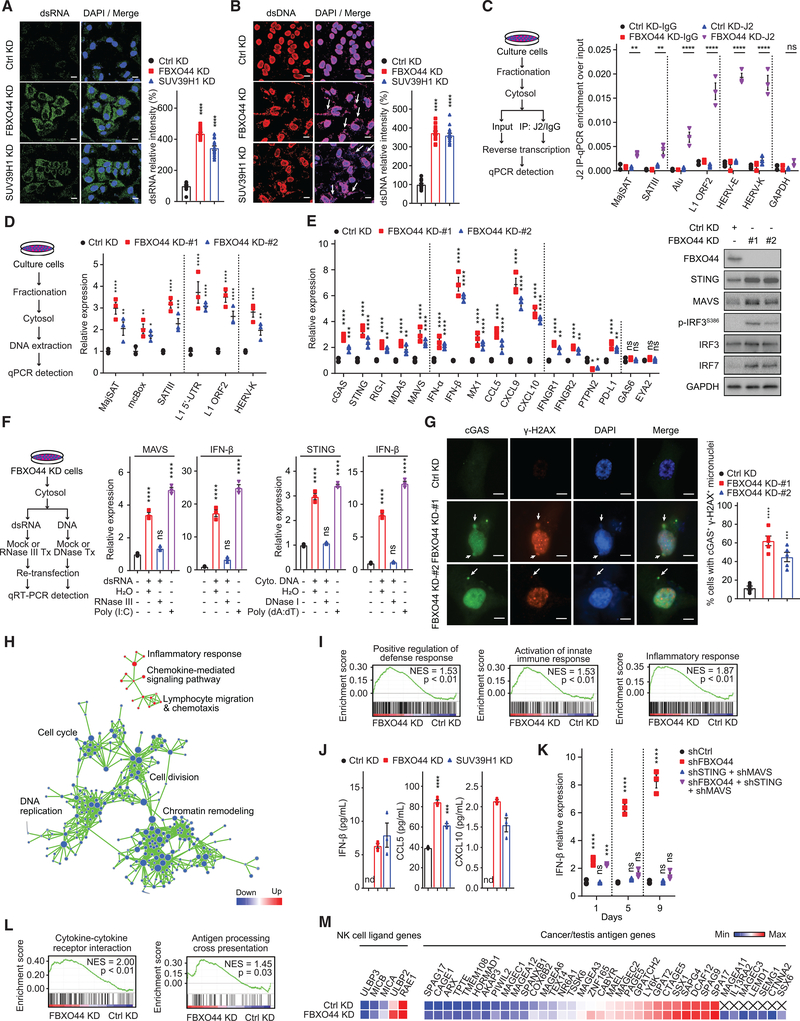
Figure 4. FBXO44 inhibition activates RIG-I/MDA5-MAVS and cGAS-STING antiviral pathways and IFN signaling and enhances cancer cell immunogenicity.
(A and B) IF images of MDA-MB-231 cells (left panels) and quantification of relative intensity (right panels) of dsRNA (A) and dsDNA (B, arrows) (n = 15). Scale bar, 10 μm.
(C and D) qRT-PCR analysis of the indicated REs (n = 3) (right panels). Protocols are shown (left panels).
(E) qRT-PCR analysis (n = 3) (left panel). Immunoblots of the indicated proteins (right panel).
(F) qRT-PCR analysis (n = 3) (middle and right panels). Schematic of protocol (left panel).
(G) IF images of cGAS and γH2AX positive micronuclei (left panel). DNA stained with DAPI. Scale bar, 5 μm. Quantification is shown (n = 5) (right panel).
(H) Pathway enrichment map for significantly enriched gene sets in GSEA of FBXO44 KD RNA-seq. p < 0.01; false discovery rate (FDR) <0.1.
(I) GSEA enrichment plots for selected gene sets in FBXO44 KD RNA-seq.
(J) ELISA quantification of IFN-β, CCL5, and CXCL10 (n = 3).
(K) qRT-PCR analysis of IFN-β (n = 3). Day is time post-KD.
(L) GSEA analysis of immune-stimulatory pathways.
(M) Heatmap of representative genes from RNA-seq data.
Data represent mean ± SEM. ns, not significant; nd, not detected; *p < 0.05, **p < 0.01, ***p < 0.001, ****p < 0.0001 by one-way ANOVA followed by Tukey’s multiple comparisons test (A, B, and F), Dunnett’s multiple comparisons test (G), two-way ANOVA followed by Tukey’s multiple comparisons test (C and K), Dunnett’s multiple comparisons test (D), Sidak’s multiple comparisons test (E), and unpaired Student’s t test (J).

