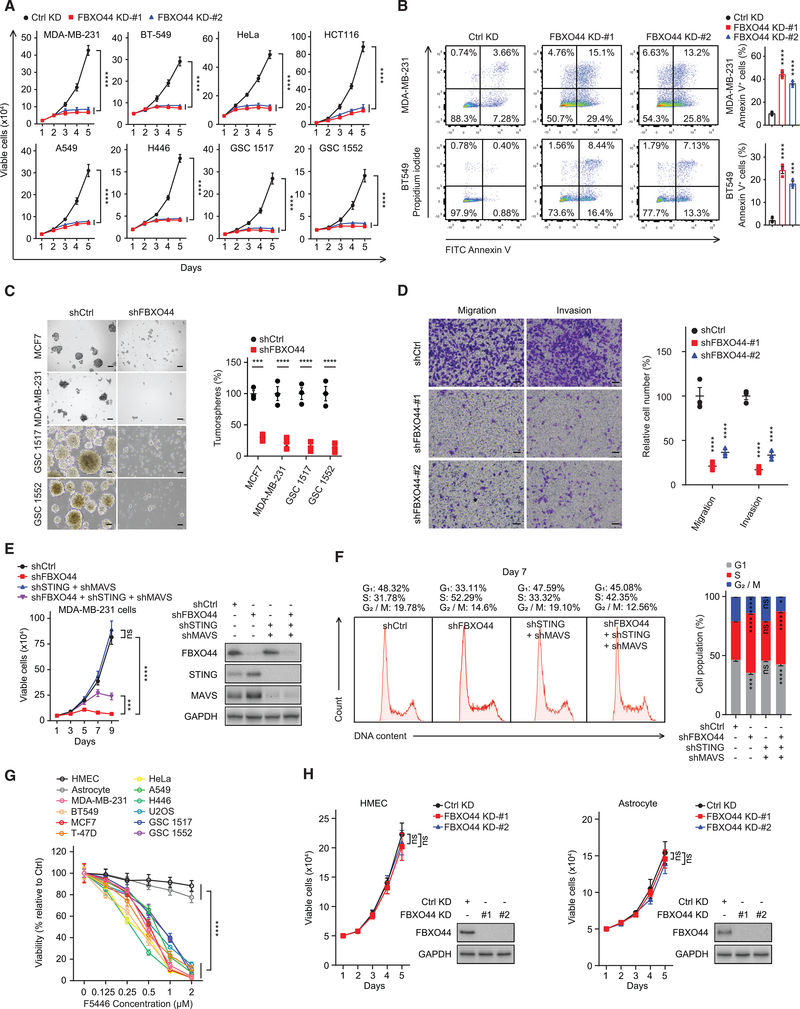
Figure 5. FBXO44/SUV39H1 inhibition selectively decreases cancer cell proliferation and viability in vitro.
(A) Growth curves of the indicated cancer cell lines and patient-derived glioblastoma cultures (n = 3).
(B) Representative flow cytometry analysis of apoptotic (annexin V+) cells (left panel). Quantification is shown (n = 3) (right panel).
(C) Representative images (left panel) and quantification (right panel) of tumorspheres (n = 3) at day 14. Scale bar, 100 μm.
(D) Representative images (left panel) and quantification (n = 3) (right panel) of migration and invasion analyses of MDA-MB-231 cells. Scale bar, 50 μm.
(E) Growth curves (n = 3) (left panel) and immunoblots of FBXO44, MAVS, and STING (right panel).
(F) Flow cytometry analysis of cell cycle (left panel) and quantification (n = 3) (right panel).
(G) Viabilities of the indicated cells after treatment with F5446 for 48 h (n = 3).
(H) Growth curves of HMECs and astrocytes (n = 3) (left panels) and immunoblots of the indicated proteins (right panels).
Data represent mean ± SEM. ns, not significant; ***p < 0.001, ****p < 0.0001 by one-way ANOVA followed by Dunnett’s multiple comparisons test (B and D), and two-way ANOVA followed by Dunnett’s multiple comparisons test (A), Sidak’s multiple comparisons test (C), Tukey’s multiple comparisons test (E, F, G, and H).
See also Figure S5.

