. 2021 Mar 5;8(1):24–35. doi: 10.5455/javar.2021.h481

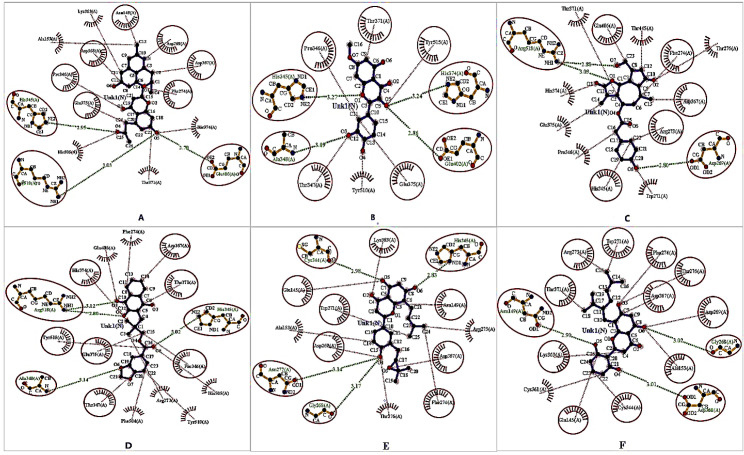
Figure 2. The docked conformation of the ACE2–lead molecule complexes represents the possible hydrogen and hydrophobic interactions, where hydrogen bonds are shown as olive green dotted lines with a specific distance (Å) that are illustrated in red color oval-shaped structures. The hydrophobic interactions are indicated with thin red lines with ellipses in protein residues via the red circle. The red color spiked arc ellipses indicate the protein residues that are mainly equivalent in 3D positions to the residues. Cassiarin D–ACE2 complex (A), Rhamnetin–ACE2 complex (B), Lactupicrin–ACE2 complex (C), Rhinacanthin D–ACE2 complex (D), Flemiflavanone D–ACE2 complex (E), and Exiguaflavanone A–ACE2 complex (F).

Figure 2.