. 2020 Dec 23;3(2):e200198. doi: 10.1148/ryai.2020200198

Figure 4:

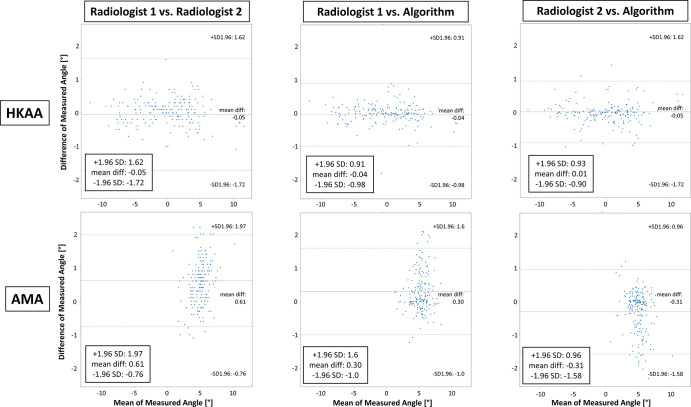
Comparative evaluation of manual and automatic assessment of lower extremity alignment based on the hip-knee-ankle angle (HKAA) and the femoral anatomic-mechanical-angle (AMA). Bland-Altman plots display the agreement of both radiologists’ manual reference measurements (radiologist 1 and radiologist 2) and the algorithm-based measurements of both measures. Upper and lower rows detail pairwise comparisons for the HKAA and AMA, respectively, between both radiologists (left column), radiologist 1 and the algorithm (middle column), and radiologist 2 and the algorithm (right column). Note that differences of measured angles are more strongly discretized because of the finite accuracy with which the HKAA and AMA were measured manually. diff = difference, SD = standard deviation.

Comparative evaluation of manual and automatic assessment of lower extremity alignment based on the hip-knee-ankle angle (HKAA) and the femoral anatomic-mechanical-angle (AMA). Bland-Altman plots display the agreement of both radiologists’ manual reference measurements (radiologist 1 and radiologist 2) and the algorithm-based measurements of both measures. Upper and lower rows detail pairwise comparisons for the HKAA and AMA, respectively, between both radiologists (left column), radiologist 1 and the algorithm (middle column), and radiologist 2 and the algorithm (right column). Note that differences of measured angles are more strongly discretized because of the finite accuracy with which the HKAA and AMA were measured manually. diff = difference, SD = standard deviation.