. 2020 Dec 2;3(2):e200137. doi: 10.1148/ryai.2020200137

Figure 5a:

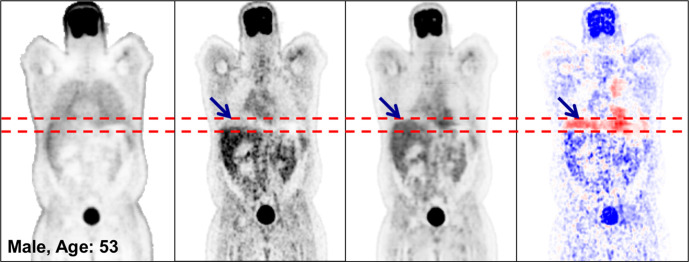
Coronal PETNC (far left column), PETASC (second from left column), PETDL (third from left column), and PETDL − PETASC (far right column) images illustrate the potential benefits of PETDL in (a) a patient with attenuation artifacts at the liver dome (blue arrows) and (b) a patient with washout artifacts near the bladder, who was excluded from the training set because of significant photopenic artifact. The pixel units on the difference images (far right) are standardized uptake values. Red dashed lines indicate range of the bladder. Blue and red coloration indicate under- and overestimated voxels in PETDL compared to the reference PETASC.

Coronal PETNC (far left column), PETASC (second from left column), PETDL (third from left column), and PETDL − PETASC (far right column) images illustrate the potential benefits of PETDL in (a) a patient with attenuation artifacts at the liver dome (blue arrows) and (b) a patient with washout artifacts near the bladder, who was excluded from the training set because of significant photopenic artifact. The pixel units on the difference images (far right) are standardized uptake values. Red dashed lines indicate range of the bladder. Blue and red coloration indicate under- and overestimated voxels in PETDL compared to the reference PETASC.