. 2020 Dec 23;3(2):e190181. doi: 10.1148/ryai.2020190181

Figure 6:

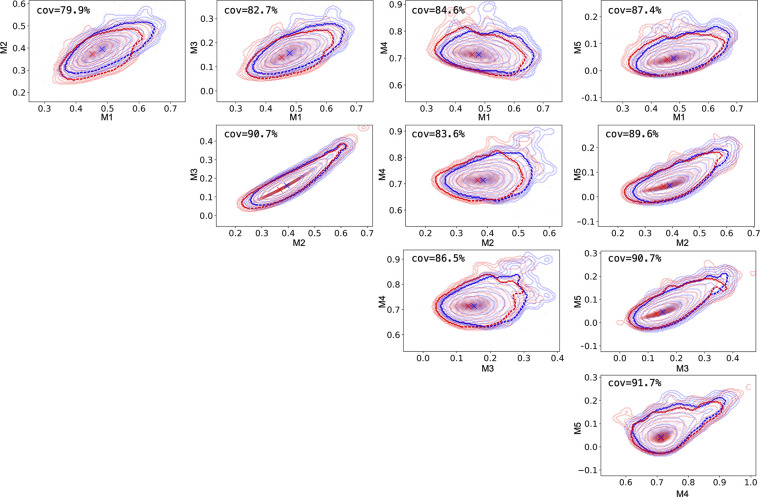
Distributional alignment of moments. We use kernel-density estimation plots to approximate the distributions of real and synthetic images, drawn in red and blue, respectively. We show the contours of the kernel-density estimation plots drawn at 10 regular intervals between the 95th and 99.99th percentile. More prominent dashed lines denote the contours at the 97th percentile and with x, we draw the models of the kernel-density estimation plots. Finally, we show the percentage of the real contour covered by the synthetic image contour at the 97th percentile. cov = covariance.

Distributional alignment of moments. We use kernel-density estimation plots to approximate the distributions of real and synthetic images, drawn in red and blue, respectively. We show the contours of the kernel-density estimation plots drawn at 10 regular intervals between the 95th and 99.99th percentile. More prominent dashed lines denote the contours at the 97th percentile and with x, we draw the models of the kernel-density estimation plots. Finally, we show the percentage of the real contour covered by the synthetic image contour at the 97th percentile. cov = covariance.