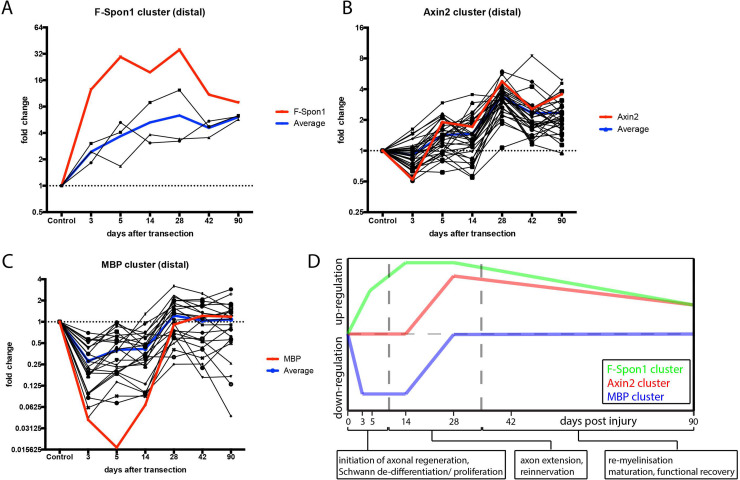
Fig 4. Wnt pathway gene clusters in the distal stump of the transected sciatic nerve.
The temporal expression profiles of individual genes in the F-Spondin1, Axin2 and MBP clusters in the distal stump were plotted to visualize the coordinated nature of the expression of Wnt-pathway genes after nerve transection. Black lines represent individual genes, blue lines indicate average regulation and red lines indicate regulation of the marker gene (F-spon1, MBP) or the Wnt2b or Axin2 gene. A, The F-Spondin cluster contains genes which are up- regulated from early time points onward (3d p.i.) and remains up-regulated up to late (90d p.i.) timepoints. B, The genes in the Axin2 cluster exhibit an up- regulation at later time points (14–28d p.i.) and remain up-regulated up to 42 to 90d p.i. C, The MBP cluster consist of genes that are down-regulated at early timepoints (3 - 14d p.i.) and return to baseline around 28d p.i. D, Schematic representation of the F-Spondin1 (green), Axin2 (red) and MBP (blue) clusters with an indication of their correspondence to post-injury repair events in the peripheral nerve as indicated at the X-axis of the graph suggesting that these genes may have a role in these processes.

